vitormhenrique
Well-known member
Hello Guys,
I Home you don't mid helping me on this basic question, I'm a chemical engineer, had my calculus and vaguely remember Fourier transform....
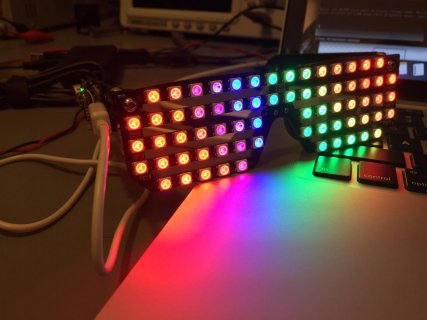
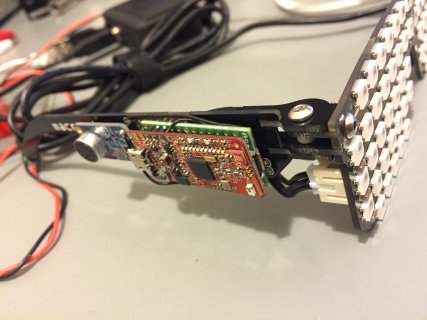
I dowloaded the Teensy-LC FFT Library and wanted to build a small Spectrum Analyzer on my RGB Shades.
But I don't understand what the output of the fft means, how can I translate that to the frequencies, and amplitudes.
The example code is this:
And the output that it print is this:
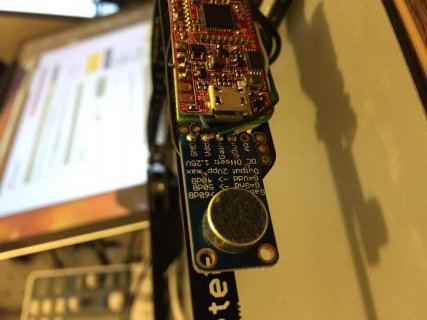
I have a cheap oscilloscope, I can see that the mic is outputting beautiful data... so, basically could you help me translate the fft output to something that I can work on?
I Home you don't mid helping me on this basic question, I'm a chemical engineer, had my calculus and vaguely remember Fourier transform....
I dowloaded the Teensy-LC FFT Library and wanted to build a small Spectrum Analyzer on my RGB Shades.
But I don't understand what the output of the fft means, how can I translate that to the frequencies, and amplitudes.
The example code is this:
Code:
#include "LCAnalyzeFFT.h"

LCAnalyzeFFT LCFFT;

void setup() {
	Serial.begin(9600);
	delay(2000);
	Serial.println("hello");

	// Initialize the library with the appropriate input pin
	LCFFT.init(A9);
	// enable sampling
	LCFFT.enable();
}

int counter = 0;
void loop() {
	static unsigned long start = millis();
	// wait until data is available
	if(LCFFT.available()) {
		counter++;
		if((millis() - start) > 1000) {
			Serial.println(counter);
			counter = 0;
			start = millis();
		}
		for(int i = 0 ;i < 32; i++) {
			int32_t sum = 0;
			for(int j = 0; j < 4; j++) {
				sum += LCFFT.output[i*4+j];
			}
			Serial.print(sum);
			Serial.print(" | ");
		}
		Serial.println();
	}
}
And the output that it print is this:
Code:
1067 | 8 | 8 | 8 | 4 | 6 | 7 | 6 | 2 | 5 | 3 | 5 | 3 | 4 | 6 | 7 | 2 | 2 | 3 | 2 | 3 | 1 | 1 | 4 | 2 | 2 | 1 | 3 | 3 | 2 | 3 | 4 |
1070 | 9 | 8 | 8 | 2 | 3 | 5 | 6 | 5 | 6 | 6 | 6 | 4 | 5 | 4 | 6 | 1 | 1 | 1 | 2 | 1 | 3 | 2 | 3 | 3 | 2 | 3 | 1 | 2 | 3 | 2 | 3 |
1067 | 8 | 8 | 8 | 3 | 6 | 6 | 8 | 4 | 3 | 7 | 3 | 3 | 6 | 4 | 7 | 1 | 3 | 1 | 1 | 1 | 3 | 1 | 3 | 2 | 1 | 2 | 3 | 1 | 3 | 2 | 3 |
1069 | 8 | 8 | 8 | 6 | 4 | 7 | 8 | 2 | 3 | 7 | 4 | 5 | 5 | 4 | 7 | 1 | 2 | 2 | 1 | 2 | 2 | 3 | 3 | 1 | 0 | 4 | 3 | 3 | 1 | 2 | 2 |
1066 | 9 | 8 | 9 | 2 | 7 | 5 | 7 | 1 | 6 | 6 | 5 | 3 | 6 | 3 | 6 | 2 | 1 | 2 | 0 | 1 | 5 | 2 | 2 | 0 | 3 | 2 | 2 | 3 | 3 | 2 | 2 |
1066 | 8 | 8 | 8 | 3 | 5 | 5 | 8 | 2 | 4 | 4 | 4 | 3 | 4 | 3 | 7 | 2 | 3 | 2 | 1 | 2 | 2 | 1 | 2 | 1 | 2 | 2 | 2 | 2 | 0 | 2 | 2 |
1068 | 9 | 8 | 8 | 1 | 6 | 5 | 7 | 3 | 4 | 7 | 4 | 2 | 6 | 3 | 5 | 3 | 4 | 1 | 3 | 1 | 3 | 3 | 3 | 2 | 3 | 4 | 2 | 2 | 5 | 4 | 1 |
1070 | 8 | 8 | 8 | 3 | 5 | 5 | 6 | 3 | 4 | 6 | 5 | 4 | 4 | 7 | 6 | 2 | 4 | 0 | 1 | 2 | 3 | 2 | 1 | 2 | 2 | 3 | 3 | 1 | 2 | 3 | 3 |
1067 | 8 | 8 | 8 | 4 | 5 | 5 | 7 | 4 | 3 | 5 | 5 | 3 | 3 | 3 | 7 | 3 | 2 | 4 | 1 | 1 | 1 | 3 | 2 | 3 | 2 | 2 | 4 | 3 | 2 | 3 | 2 |
1067 | 8 | 8 | 8 | 2 | 5 | 4 | 6 | 2 | 5 | 6 | 4 | 3 | 7 | 1 | 7 | 1 | 2 | 2 | 2 | 2 | 4 | 2 | 3 | 1 | 3 | 2 | 4 | 2 | 4 | 0 | 5 |
1069 | 8 | 8 | 8 | 5 | 5 | 5 | 7 | 4 | 4 | 6 | 4 | 4 | 3 | 6 | 7 | 2 | 1 | 2 | 2 | 1 | 2 | 2 | 3 | 1 | 3 | 3 | 2 | 2 | 1 | 4 | 2 |
1069 | 8 | 8 | 8 | 3 | 4 | 7 | 7 | 3 | 4 | 4 | 3 | 3 | 6 | 6 | 7 | 1 | 2 | 0 | 3 | 0 | 3 | 1 | 3 | 0 | 1 | 3 | 2 | 0 | 3 | 2 | 4 |
1067 | 8 | 8 | 9 | 3 | 6 | 6 | 7 | 1 | 4 | 5 | 6 | 4 | 4 | 8 | 8 | 0 | 2 | 1 | 1 | 1 | 3 | 3 | 1 | 0 | 1 | 3 | 2 | 2 | 2 | 3 | 3 |
1064 | 9 | 8 | 8 | 3 | 5 | 5 | 7 | 3 | 3 | 5 | 4 | 4 | 5 | 5 | 7 | 3 | 2 | 2 | 3 | 1 | 3 | 2 | 2 | 4 | 3 | 2 | 0 | 2 | 3 | 2 | 4 |
1068 | 8 | 8 | 8 | 5 | 5 | 5 | 8 | 3 | 5 | 5 | 5 | 5 | 6 | 4 | 7 | 4 | 1 | 1 | 2 | 1 | 1 | 4 | 3 | 2 | 2 | 2 | 4 | 4 | 1 | 4 | 3 |
1066 | 9 | 8 | 9 | 5 | 5 | 7 | 8 | 2 | 5 | 6 | 5 | 5 | 5 | 5 | 7 | 0 | 3 | 3 | 1 | 2 | 3 | 4 | 2 | 1 | 1 | 2 | 2 | 2 | 4 | 5 | 3 |
I have a cheap oscilloscope, I can see that the mic is outputting beautiful data... so, basically could you help me translate the fft output to something that I can work on?


