fms1961
Well-known member
Though it's not a real project, I like to post some expriences in visualizing the frequency responses of filters implemented in the great Teensy board together with the audio library and the audio adaptor card.
The reason was, that I experimented with a miniDSP and the "Room EQ Wizard" (REW) to generate some room corrections based on measurements with a calibrated microphone. Because of the fact that REW measures and generates a bunch of filter settings by itself, which might be imported to the miniDSP as well as to a big number of other DSP solutions, I thought this must be applied on the Teensy 3.2 - the functionality lies there, when we use the Audio System Design Tool, several filters occur, so I thought to use some BiQuad filters to implement the correction curve created by REW.
As REW exports it's settings also for BiQuad filters, I just assembled a minimalistic input - filter - output system for the Teensy 3.2 and imported the coefficients in the Arduino sketch for the BiQuads as provided by the REW. Unfortunaltely the Teensy only created some very high pitched noise - no audio was processed in the sketch. For the moment I do not know what was wrong with the coefficients, because the data had been exported in the expected B0,B1,B2,A0,A1 format. And there were 6 filter sections, so I implemented four of them in one BiQuad filter and the other two in a second instance cascaded after the first.
As this didn't work as expected, I was able to see the calculated correction curve in RWE as a list of peak type filters like known from parametric equalizers. So my hope was to set the parameters in this way in the Teensy, but unfortunately, the "peak" filter type is not implemented in the audio library. So this path was a dead end as well and I had to look for another solution. While doing some research, I stumbled upon the "BiQuad calculator v2" - and here I could generate my coefficient values from the filter parameters freq, Q and gain - and these coefficients could be applied to the Teensy BiQuad filter and worked - well, not absolutetly as expected, but the direction was ok.
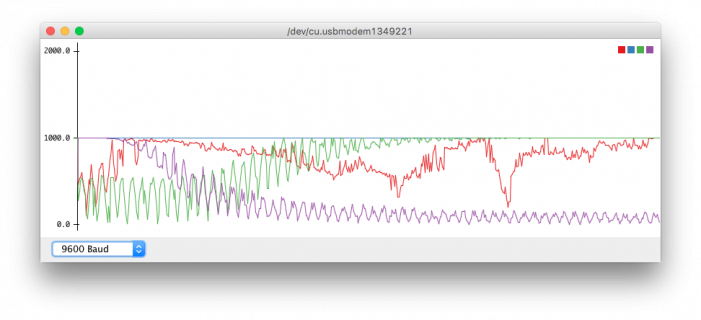
So now I was curious - and it was eager to see the frequency response on the filter as the Teensy executed it. And I remembered the new functionality of the "serial plotter" in the Arduino IDE. Some first test had been disillusioning - but after some research I found a little solution - well, this is more of a decent hack - which enables me to plot several curves in several colours in the serial plotter like this:

This is the result of my test application, you find the source when scrolling down. The thing is: the "serial plotter" when opened, will set numerical values via "Serial.println(<a number>);" as Y-Values in the plotter window, the X-Value is always the "next tick", means the next call of "Serial.println()" moves one "tick" to the right (step is 1/500 of the axis).
So you may not postion a value at an absolute position in the X axis, right? Wrong! ;-) There is a solution.
At first it's good to know, that the plotter always scales an array of 500 values over the X axis. it's hard coded - I looked into the original code ... Not very elegant, but helpful to know. So I prepared a buffer with 500 values, and I copied my values to plot into this buffer, the X position scaled to 500 possible positions according to the expected corrdinate. This was the first "hack". The second one is evil ... if you call "Serial.end();" before plotting your data, then after a liitle delay, restarts with "Serial.begin(<baudrate>);" - the next plot will be set at the position X = 0. So if you have prepared your values to plot in the described 500 values array, you may now plot them nearly at once and the stop the serial output again with "Serial.end();". And they will always be on the same position - the plotted values won't scroll out of the screen as usual.
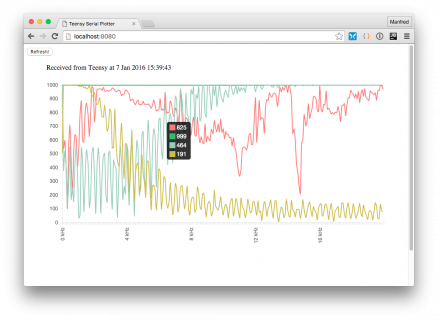
With this solution I'm now able to compare several response curves altogether, also because there is a new feature in the plotter: if you print a comma separated list of values as "Serial.println('<val1>,<val2>,<val3>,<val4>');", these will be printed as several Y values on the same X axis postion - and in different colors as well! These colors you may also customize, therefor you have to search the file "theme.txt". Unfortunately this file lies in the system path of the Arduino IDE, so if you know what you are doing, there is no problem to define the desired plot colors by yourself (mind the backup!). Look for the section "GUI - PLOTTING". Example follows.
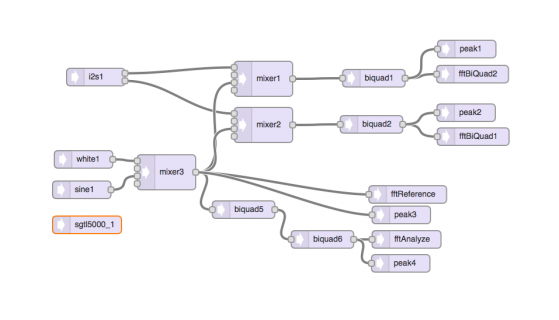
For my little test I plugged some audio objects together, so I may examine some filters via white noise as input and an FFT object to analyze the frequency spectrum, or I use the sine generator and sweep the frequencies by myself and measures the results via the "peak" object. Both ways do their job, but the sweeping method seems a to be a little more accurate.
This is the test application in the Audio System Design Tool (be aware: you need the Arduino IDE 1.6.7 and the current beta version of "Teensyduino" and Pauls audio adaptor to implement the following sketch):

Now I hope no one is bored because of my long posting - feel free to use and/or change the sketch and discuss the theme in this thread. Please be aware that this is only an application for test purposes, the filter settings are very individual. So do not use them on normal levels on your audio equipment without checking at first hand if all is in secure ranges.
(Unless required by applicable law or agreed to in writing, the software provided here is distributed on an "AS IS" BASIS, WITHOUT WARRANTIES OR CONDITIONS OF ANY KIND, either express or implied. Use it at your own risk.)
MiniDRC.ino
and here are the coefficients (calculated by REW and "transformed" by the BiQuad calculator):
Filter.h
... and an example for a customized "theme.txt" file:
The reason was, that I experimented with a miniDSP and the "Room EQ Wizard" (REW) to generate some room corrections based on measurements with a calibrated microphone. Because of the fact that REW measures and generates a bunch of filter settings by itself, which might be imported to the miniDSP as well as to a big number of other DSP solutions, I thought this must be applied on the Teensy 3.2 - the functionality lies there, when we use the Audio System Design Tool, several filters occur, so I thought to use some BiQuad filters to implement the correction curve created by REW.
As REW exports it's settings also for BiQuad filters, I just assembled a minimalistic input - filter - output system for the Teensy 3.2 and imported the coefficients in the Arduino sketch for the BiQuads as provided by the REW. Unfortunaltely the Teensy only created some very high pitched noise - no audio was processed in the sketch. For the moment I do not know what was wrong with the coefficients, because the data had been exported in the expected B0,B1,B2,A0,A1 format. And there were 6 filter sections, so I implemented four of them in one BiQuad filter and the other two in a second instance cascaded after the first.
As this didn't work as expected, I was able to see the calculated correction curve in RWE as a list of peak type filters like known from parametric equalizers. So my hope was to set the parameters in this way in the Teensy, but unfortunately, the "peak" filter type is not implemented in the audio library. So this path was a dead end as well and I had to look for another solution. While doing some research, I stumbled upon the "BiQuad calculator v2" - and here I could generate my coefficient values from the filter parameters freq, Q and gain - and these coefficients could be applied to the Teensy BiQuad filter and worked - well, not absolutetly as expected, but the direction was ok.
So now I was curious - and it was eager to see the frequency response on the filter as the Teensy executed it. And I remembered the new functionality of the "serial plotter" in the Arduino IDE. Some first test had been disillusioning - but after some research I found a little solution - well, this is more of a decent hack - which enables me to plot several curves in several colours in the serial plotter like this:

This is the result of my test application, you find the source when scrolling down. The thing is: the "serial plotter" when opened, will set numerical values via "Serial.println(<a number>);" as Y-Values in the plotter window, the X-Value is always the "next tick", means the next call of "Serial.println()" moves one "tick" to the right (step is 1/500 of the axis).
So you may not postion a value at an absolute position in the X axis, right? Wrong! ;-) There is a solution.
At first it's good to know, that the plotter always scales an array of 500 values over the X axis. it's hard coded - I looked into the original code ... Not very elegant, but helpful to know. So I prepared a buffer with 500 values, and I copied my values to plot into this buffer, the X position scaled to 500 possible positions according to the expected corrdinate. This was the first "hack". The second one is evil ... if you call "Serial.end();" before plotting your data, then after a liitle delay, restarts with "Serial.begin(<baudrate>);" - the next plot will be set at the position X = 0. So if you have prepared your values to plot in the described 500 values array, you may now plot them nearly at once and the stop the serial output again with "Serial.end();". And they will always be on the same position - the plotted values won't scroll out of the screen as usual.
With this solution I'm now able to compare several response curves altogether, also because there is a new feature in the plotter: if you print a comma separated list of values as "Serial.println('<val1>,<val2>,<val3>,<val4>');", these will be printed as several Y values on the same X axis postion - and in different colors as well! These colors you may also customize, therefor you have to search the file "theme.txt". Unfortunately this file lies in the system path of the Arduino IDE, so if you know what you are doing, there is no problem to define the desired plot colors by yourself (mind the backup!). Look for the section "GUI - PLOTTING". Example follows.
For my little test I plugged some audio objects together, so I may examine some filters via white noise as input and an FFT object to analyze the frequency spectrum, or I use the sine generator and sweep the frequencies by myself and measures the results via the "peak" object. Both ways do their job, but the sweeping method seems a to be a little more accurate.
This is the test application in the Audio System Design Tool (be aware: you need the Arduino IDE 1.6.7 and the current beta version of "Teensyduino" and Pauls audio adaptor to implement the following sketch):

Now I hope no one is bored because of my long posting - feel free to use and/or change the sketch and discuss the theme in this thread. Please be aware that this is only an application for test purposes, the filter settings are very individual. So do not use them on normal levels on your audio equipment without checking at first hand if all is in secure ranges.
(Unless required by applicable law or agreed to in writing, the software provided here is distributed on an "AS IS" BASIS, WITHOUT WARRANTIES OR CONDITIONS OF ANY KIND, either express or implied. Use it at your own risk.)
MiniDRC.ino
Code:
// GUItool: begin automatically generated code
#include <Audio.h>
#include <Wire.h>
#include <SPI.h>
#include <SD.h>
#include <SerialFlash.h>
#include "Filter.h"

AudioAnalyzeFFT256      fftAnalyze;     //xy=649,456
AudioAnalyzeFFT256      fftBiQuad1;       //xy=742.5,180
AudioAnalyzeFFT256      fftBiQuad2;       //xy=747.5,259
AudioAnalyzeFFT256      fftReference;   //xy=651,379
AudioAnalyzePeak         peak1;          //xy=729,218
AudioAnalyzePeak         peak2;          //xy=734,296
AudioAnalyzePeak         peak3;          //xy=640,414
AudioAnalyzePeak         peak4;          //xy=639,497
AudioFilterBiquad        biquad1;        //xy=593.5,180
AudioFilterBiquad        biquad2;        //xy=589.5,259
AudioFilterBiquad        biquad5;        //xy=370,405
AudioFilterBiquad        biquad6;        //xy=505,456
AudioInputI2S            i2s1;           //xy=117,178
AudioMixer4              mixer1;         //xy=404.5,181
AudioMixer4              mixer2;         //xy=404.5,260
AudioMixer4              mixer3;         //xy=238,341
AudioSynthNoiseWhite     white1;         //xy=96,319
AudioSynthWaveformSine   sine1;          //xy=93,371
AudioConnection          patchCord1(sine1, 0, mixer3, 2);
AudioConnection          patchCord10(biquad5, biquad6);
AudioConnection          patchCord11(mixer1, biquad1);
AudioConnection          patchCord12(mixer2, biquad2);
AudioConnection          patchCord13(biquad6, fftAnalyze);
AudioConnection          patchCord14(biquad6, peak4);
AudioConnection          patchCord15(biquad2, fftBiQuad1);
AudioConnection          patchCord16(biquad2, peak2);
AudioConnection          patchCord17(biquad1, fftBiQuad2);
AudioConnection          patchCord18(biquad1, peak1);
AudioConnection          patchCord2(white1, 0, mixer3, 0);
AudioConnection          patchCord3(i2s1, 0, mixer1, 0);
AudioConnection          patchCord4(i2s1, 1, mixer2, 0);
AudioConnection          patchCord5(mixer3, 0, mixer1, 2);
AudioConnection          patchCord6(mixer3, 0, mixer2, 2);
AudioConnection          patchCord7(mixer3, biquad5);
AudioConnection          patchCord8(mixer3, fftReference);
AudioConnection          patchCord9(mixer3, peak3);
AudioControlSGTL5000     sgtl5000_1;     //xy=116,468

// GUItool: end automatically generated code

const boolean doPerformFFT  = false;
const boolean doDebugSerial = false;
const int     activeInput   = AUDIO_INPUT_LINEIN;
const int     numVal        = 500;
const int     plotPoints    = 500;
const int     countFFT      = 128;

int refValues[numVal];
int fltValues[numVal];
int bq1Values[numVal];
int bq2Values[numVal];

void setup() {
  Serial.begin(9600);
  while (!Serial);

  AudioMemory(12);

  sgtl5000_1.enable();  // Enable the audio shield
  sgtl5000_1.inputSelect(activeInput);
  sgtl5000_1.volume(0.65);

  // Configure the window algorithm to use
  fftAnalyze.windowFunction(AudioWindowHanning256);
  fftReference.windowFunction(AudioWindowHanning256);
  fftBiQuad1.windowFunction(AudioWindowHanning256);
  fftBiQuad2.windowFunction(AudioWindowHanning256);

  // Test filters
  biquad1.setHighpass(0, 6000, 0.707);
  biquad1.setHighpass(1, 6000, 0.707);
  biquad1.setHighpass(2, 6000, 0.707);
  biquad1.setHighpass(3, 6000, 0.707);
  biquad2.setLowpass(0, 4000, 0.707);
  biquad2.setLowpass(1, 4000, 0.707);
  biquad2.setLowpass(2, 4000, 0.707);
  biquad2.setLowpass(3, 4000, 0.707);

  // settings: input - generator, generator - sine
  mixer1.gain(0, 0);
  mixer1.gain(2, 1.0);
  mixer2.gain(0, 0);
  mixer2.gain(2, 1.0);

  // filters set direct by BiQuad coefficients
  // room response measured with "Room EQ Wizard" - http://www.roomeqwizard.com/
  // also EQ settings calcilated by REW
  // coefficients re-calcualted with "BiQuad Calculator"
  // URL: http://www.earlevel.com/main/2013/10/13/biquad-calculator-v2/
  // the values calculated by REW did not work with the Teensy BiQuad filter
  biquad5.setCoefficients(0, coeff_A);
  biquad5.setCoefficients(1, coeff_B);
  biquad5.setCoefficients(2, coeff_C);
  biquad5.setCoefficients(3, coeff_D);
  biquad6.setCoefficients(0, coeff_E);
  biquad6.setCoefficients(1, coeff_F);

  if (doDebugSerial) {
    Serial.println("Setup finished.");
  }
}

void loop() {
  if (doPerformFFT) {
    // sound generators for filter testing
    AudioNoInterrupts();
    white1.amplitude(1.0);
    sine1.frequency(0);
    sine1.amplitude(0.0);
    mixer3.gain(0, 1.0);
    mixer3.gain(2, 0.0);
    AudioInterrupts();

    getFFT(fftReference, refValues);
    getFFT(fftAnalyze, fltValues);
    getFFT(fftBiQuad1, bq1Values);
    getFFT(fftBiQuad2, bq2Values);

  } else {
    // sound generators for filter testing
    AudioNoInterrupts();
    white1.amplitude(0.0);
    sine1.frequency(0);
    sine1.amplitude(1.0);
    mixer3.gain(0, 0.0);
    mixer3.gain(2, 1.0);
    AudioInterrupts();

    int freq = 0;
    int step = (int) floor(20000 / numVal);
    int pos = 0;
    int toLen = 2000;
    int timeout = 0;
    int i;
    char buff[10];

    while (pos < numVal) {
      freq += step;
      AudioNoInterrupts();
      sine1.frequency(freq);
      sine1.amplitude(1.0);
      AudioInterrupts();

      delay(10);
      bq1Values[pos] = peak1.available() ? peak1.read() * 1000 : 0;
      delay(10);
      bq2Values[pos] = peak2.available() ? peak2.read() * 1000 : 0;
      delay(10);
      refValues[pos] = peak3.available() ? peak3.read() * 1000 : 0;
      delay(10);
      fltValues[pos] = peak4.available() ? peak4.read() * 1000 : 0;

      if (doDebugSerial) {
        char strLog[256];
        sprintf(strLog, "Frequency: %dHz - Value: %d - Pos: %d", freq, bq1Values[pos], pos);
        Serial.println(strLog);
        sprintf(strLog, "Frequency: %dHz - Value: %d - Pos: %d", freq, bq2Values[pos], pos);
        Serial.println(strLog);
        sprintf(strLog, "Frequency: %dHz - Value: %d - Pos: %d", freq, refValues[pos], pos);
        Serial.println(strLog);
        sprintf(strLog, "Frequency: %dHz - Value: %d - Pos: %d", freq, fltValues[pos], pos);
        Serial.println(strLog);
      }

      pos++;
    }
  }

  Serial.end();
  delay(4000);

  Serial.begin(9600);
  while (!Serial);

  for (int i = 0; i < plotPoints; i++) {
    int j = floor(i * numVal) / plotPoints;
    char strTmp[256];
    sprintf(strTmp, "%d,%d,%d,%d", fltValues[j], refValues[j], bq1Values[j], bq2Values[j]);
    Serial.println(strTmp);
  }
  Serial.end();
}

void getFFT(AudioAnalyzeFFT256 currFFT, int buffer[]) {

  if (currFFT.available()) {
    // each time new FFT data is available
    int i;
    for (i = 0; i < numVal; i++) {
      int n;
      int pos = floor((i * countFFT) / numVal);
      buffer[i] = 0;
      n = (int) floor((currFFT.read(pos) * 100000.0) + 0.5);
      if (n > 1) {
        buffer[i] = (buffer[i] + n) / 2;
      }
    }
  }
}
and here are the coefficients (calculated by REW and "transformed" by the BiQuad calculator):
Filter.h
Code:
const double coeff_A[5] =  {
  0.9610370225401147,
  -1.9107972784262903,
  0.9502475801102773,
  -1.9107972784262903,
  0.9112846026503919
};
const double coeff_B[5] =  {
  0.9894743749421135,
  -1.9683683060313137,
  0.9808030226118714,
  -1.9683683060313137,
  0.9702773975539849
};
const double coeff_C[5] =  {
  0.8476799889286674,
  -1.6302405720420894,
  0.7870622969008821,
  -1.6302405720420894,
  0.6347422858295495
};
const double coeff_D[5] =  {
  0.999070171739494,
  -1.9770337719473552,
  0.9838293908949015,
  -1.9770337719473552,
  0.9828995626343955
};
const double coeff_E[5] =  {
  1,
  -0.6754256087219742,
  0.9106365261669264,
  -0.6754256087219742,
  0.9106365261669264
};
const double coeff_F[5] =  {
  0.30840669576877716,
  0.4143287447804912,
  0.26829263257834,
  0.4143287447804912,
  -0.4233006716528827
};
... and an example for a customized "theme.txt" file:
Code:
# GUI - PLOTTING
# color cycle created via colorbrewer2.org
plotting.bgcolor = #ffffff
plotting.color = #ffffff
plotting.graphcolor.size = 8
#plotting.graphcolor.00 = #2c7bb6
#plotting.graphcolor.01 = #fdae61
#plotting.graphcolor.02 = #d7191c
#plotting.graphcolor.03 = #abd9e9
plotting.graphcolor.00 = #e41a1c
plotting.graphcolor.01 = #377eb8
plotting.graphcolor.02 = #4daf4a
plotting.graphcolor.03 = #984ea3
plotting.graphcolor.04 = #ff7f00
plotting.graphcolor.05 = #ffff33
plotting.graphcolor.06 = #a65628
plotting.graphcolor.07 = #f781bf
Last edited:


