MIDI CC Curve

Status
Not open for further replies.

cackland

Well-known member
Hi Guys,

Wondering if it's possible with Teensy to create several custom MIDI CC Curves.

Obviously the normal one is a straight linear line, but would like to option to have teensy select a variety of curves.

Below is an example of the kind of options I would like.
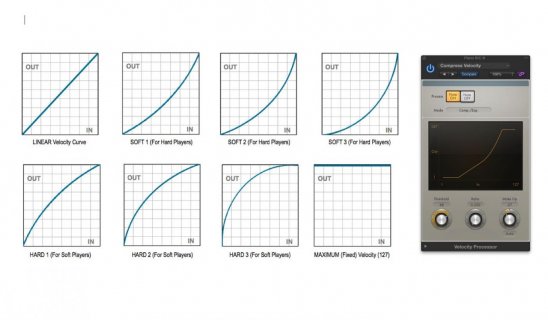
MIDI_Fig_1.jpg

Anyone have an idea on how to do this. Thanks in advance.
 
Do you mean to process a MIDI stream... yes that's easy enough but you are mapping 128 values back on 128 values; So where the slope of your curve is shallow you will repeat outputs on some adjacent inputs and where the slope steep you will skip some outputs.

If you mean to take an analog signal and map that to midi with some curve then then any additional resolution can be used to give a smoother input/output mapping... you still have the 127 steps of output but your input steps are smoother and there can be a range of inputs that map to all the possible outputs and still have some curve...

Steps to build a response curve:
  • map input to 0-1
  • apply curve function (y = x^a perhaps where a=1 is linear)
  • remap output to midi range (seven-bits).
 
Last edited:
The code might look something like this

Code:
  float x = (float)input / 127.0;
  if (x < 0) x = 0;
  if (x > 1.0) x = 1.0;
  float y = powf(x, 1.2);
  int output = y * 127.0;
 
Great, thanks Paul.

How would I plot this? Say I'm trying to calculate a soft curve for a potentiometer and then an aggressive/ steep curve. Which variable would I change?
 
Last edited:
Ok, so for a softer curve, like soft 3 (in the diagram) would it be a minus 1 number of some sort depending on the steepness?
 
There is a slider, it should let you easily pick values that create the graphs you are looking for.. find the values you want and plug them into the code Paul gave you. From my function to his code, t is '1.2'.
 
Last edited:
How does this translate to Paul's code?

It shows the x axis only moving from 0,0. Rather than the y axis @ 127 curving as well.

Wouldn't I need both 0,0 and 127,127 moving together to create a smooth curve?
 
Last edited:
Did you try using the slider? Paul's code boils down to ((x/127)^t)*127 when you graph it and ignore the if limits, where t in his code is 1.2. 1.2 is almost a straight line, which is why you should use the slider to try different values, the limits I put on the slider cover all the graphs you requested.

The point is when x = 0 y will always be 0, and when x = 127 y will always be 127.
 
Last edited:
Yes, I used the slider. It seems the 0,0 point curves much more than the 127,127 point. Shouldn't they curve equally?

Please treat me like a dummy, this is all new to me.
 
Last edited:
In the graphs you posted, 64 would be the middle on the x axis. Look at the Y value, does it bend from 64? It's higher and lower at 64 with different graphs, it bends with fixed points at 0,0 and 127,127
 
Last edited:
Sounds like you want dy/dx = 1 on all curves where they cross a diagonal between 1,0 and 0,1....

i.e symmetrical to that axes...

you'll need someone with better calculus skills than me...
 
Yes, Oddson... I assume so.

In the graphs, Soft3 and Hard3 seems to both show an equal 1/4 circle, showing (0,0) and (127,127) have equal power between 0 - 127.
 
First, if you have the Arduino Serial Monitor window open, close it.

Copy this program into Arduino and upload it to your Teensy.

Code:
void setup() {
  while (!Serial) ;
  delay(100);

  for (int i=0; i <= 127; i++) {
    float x = (float)i / 127.0;
    if (x < 0) x = 0;
    if (x > 1.0) x = 1.0;
    float y = powf(x, 1.7);
    int out = y * 127.0;
    Serial.println(out);
  }
}

void loop() {
}

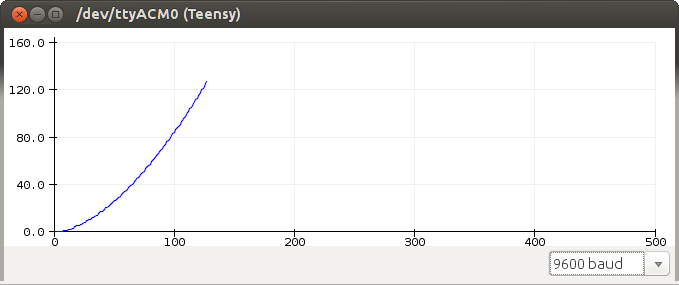
Click Tools > Serial Plotter

Then adjust the size of the window so the 0-127 range of both axes are about the same size on your screen.

sc.png

Of course, there are numerous software programs which can plot data. They usually offer many ways to customize the results. For example, you could print the numbers to the Arduino Serial Monitor and copy & paste the data into a spreadsheet like Microsoft Excel.

However, like all software, programs like Excel require some learning and skill to use effectively. I can't guide your hand with step-by-step instructions. If you're going to use such software, you're going to need to figure out the details yourself. Or get someone who knows to help you in person.

But at least Arduino has this very convenient though limited-feature plotting built in.
 
Ok thanks.

I have just updated Arduino to 1.8.1, same with Teensyduino (1.35)

When I choose Serial Plotter it states:

"
BOARD AT COM1 IS NOT AVAILABLE
"

Compiling and uploading works fine.

Help?
 
Last edited:
Unplug your Teensy. Look at Tools > Ports and make a mental note of which ports are shown.

Then plug it back in and look again. The newly appeared port is the one for Teensy. Select it.

Teensy is never COM1.
 
There is no 'Port' selection, its grayed out. The board is selected as 'Teensy 3.2 / 3.1'. USB type - MIDI.

The port section that is greyed out says "Port serial emulated"
 
Last edited:
Either change the USB Type back to Serial, or add a delay near the beginning of the code so it doesn't print before you open the window.
 
Ok that worked. Thank you. I'll check the plotter

Edit: It worked once, then when I changed a parameter in the code to play with the steepness of the curve, compiled, uploaded, now the plotter doesn't open.Had to close the whole Arduino for it to work again.

Which parameter am I changing to increase or decrease the steepness?

I changed this parameter float y = powf(x, 1.7); to 1.3 and it now comes up with an error when uploading...

Board at /dev/cu.usbmodem1888961 is not available
 
Last edited:
Close the window. Upload again. Wait a couple seconds for your Mac to detect the freshly rebooted Teensy. Then open the window again.

Look, there comes a time for everyone to learn and become self sufficient in solving problems. We can try to help you, but you also really need to strive to learn how to solve simple problems. You're never going to get far if even the smallest things require several back-and-forth messages.
 
Absolutely agree with that saying, however there also comes a time where someone is learning this whole process and ask's the community for assistance. Hence why I am here. When errors pop up, I advise for a solution as there are more experience individuals out there than myself.

I'll dare to ask you another question...

When increasing float y = powf(x, 1.7); to (desired value), the plotter shows the higher I go that y=0 until a certain point. Which would mean, that for a linear potentiometer, you may be a third of the way up the full range of its resolution before it starts to sending out a value.

Any way I can soften the curve from the value of 64, rather than at (0,0)? This way its a more symmetrical arc!
 
Last edited:
>How can I soften a curve

If you define soft as the graph y = x, you could soften these curves by averaging it with y = x. You add x and divide by 2. But I see what you are saying about the curves not being symmetric, this isn't exactly what you want.
You want to be drawing arcs of a circle, which has points that intersect both 0,0 and 127,127. https://www.desmos.com/calculator/ys8lzrce7s here's a circle mapped with your 0,0-127,127 window, it would take more coffee than I've had today to figure out how to make this parametric for the graphs you want.
 
Last edited:
Status
Not open for further replies.
Back
Top