smallbrain
New member
Why am I writing this post? Perhaps it’s because I have had some difficulty in getting the performance I would like from the ADC. My needs are simple: 12-bits of resolution, moderate noise, a moderate impedance input drive and two channels sampled at 20KHz. I have a system scaled to plus and minus 10V giving a single bit resolution of about 5mV. Note that 1-bit at the analog input is only 0.81mV.
My driving impedance is best at the high side with 5K of series resistance and 2.7nF of capacitance load. If you’re like me, you would like the system to perform without extraordinary input signal conditioning.
One of the parameters I am most interested in is the differential non-linearity. Noise can be dealt with by averaging but large differential non-linearity errors won’t be helped by averaging.
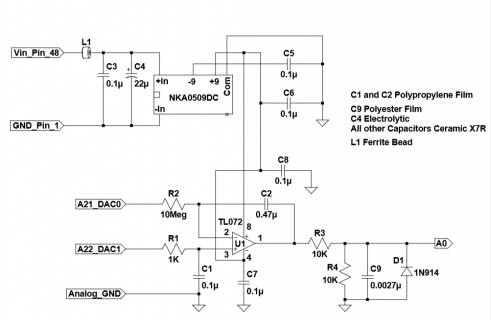
There are many ways to test ADC converters. For differential linearity, we can use a simple integrator and some math to generate an ideal reference line.
The integrator uses a polypropylene film capacitor. This type of capacitor has a low dielectric absorption. Mylar film capacitors work but will cause a larger measurement error. The dielectric absorption induces a bend in the integration slope. The bend can be removed by generating the line for a second order polynomial instead of the straight line found by linear regression.
You can perform the linearity test using the attached circuit and sketch. You will also need a serial terminal program that can capture the serial data. The captured text file is loaded into your analysis program after the first couple of text lines “Ramping Down” and “Ramping Up” are removed.
Here are some instructions for using Xcel ® to analyze the data:
1. Create a sample count index column A (series of numbers 1 to N)
2. Paste the ADC linearity text (N-values) into column B
3. Plot Column B
4. Find the 2nd order polynomial trend line for the plotted line of column B
5. Enter the equation in column C, using column A as the x value
6. Copy C1 and past into C2 through CN
7. Subtract the ADC data column B from column C and place in column D
8. Column D contains the differential linearity error
9. Make a filtered column E, e.g. E1 = SUM(A1:A7)/7
10. Copy E1 and past into E2 through EN
11. Make a scatter xy plot using column C as x and column E as y
The scatter plot is the filtered differential linearity versus ADC value 0 to 4095
The test circuit:
Attached sketch: linearity_tester_incal_comments.ino
All of the following testing is with 4 samples averaged, 16-bit single ended mode and data truncated to 12-bits.
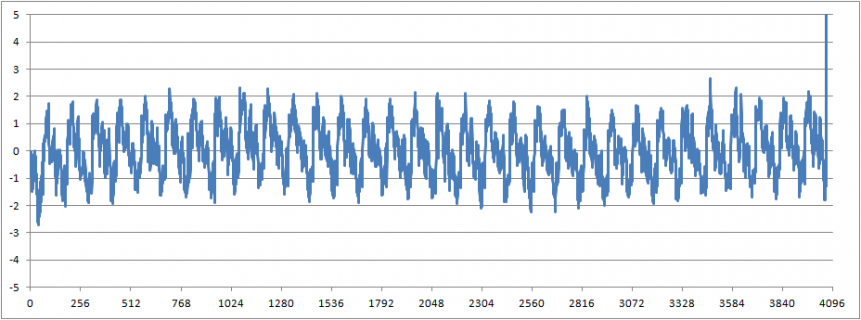
When the internal hardware gain correction is used, the ADC has a pronounced differential linearity error of about plus and minus 2-bits. The repeated pattern of 32 times suggested there is an error between the five most significant bits and the remainder of the capacitive DAC. I tried the same test on a teensy 3.5 and a teensy 3.6. Both had the same results.
Linearity test:
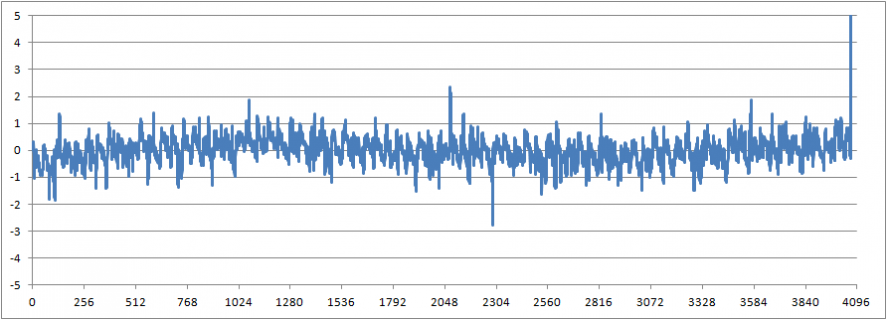
With the internal gain correction value is set to 32768 (a gain of 1.0 or no correction), the differential linearity error has no notable patterns and I have measured errors as low a plus and minus a half of bit.
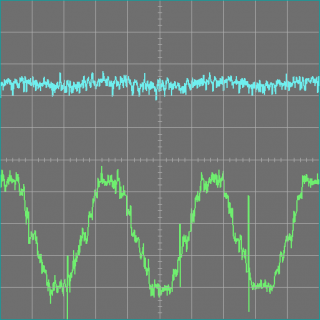
I have noticed the ADC data in my application contains a lot of random noise spikes. As a reminder, the time between measurements is 50us or a 20KHz rate.
The following graph is with the system set at 10mV per division. One input at ground level and the other driven with a 60Hz sine at plus and minus 20mV.
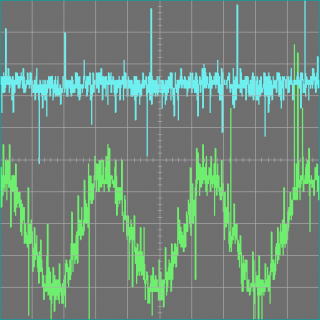
Some of the noise spikes can be removed using a nearest neighbor filter. After data is acquired, advance through the array and replace the data if the two adjacent data values are within plus and minus one bit (0.005V for my system). The data is replaced by the average of the two neighbors. The following snippet is in Pascal:
v1 := abs((v[j-1]-v[j+1]));
if (v1 < 0.008) then v[j] := (v[j-1] + v[j+1])/2;
Example of filtered data:
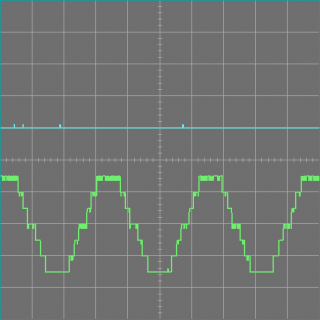
Using an external ADS8684 converter, this is what the signal looks like at 14-bits resolution. The DAC steps are clearly visible.
My driving impedance is best at the high side with 5K of series resistance and 2.7nF of capacitance load. If you’re like me, you would like the system to perform without extraordinary input signal conditioning.
One of the parameters I am most interested in is the differential non-linearity. Noise can be dealt with by averaging but large differential non-linearity errors won’t be helped by averaging.
There are many ways to test ADC converters. For differential linearity, we can use a simple integrator and some math to generate an ideal reference line.
The integrator uses a polypropylene film capacitor. This type of capacitor has a low dielectric absorption. Mylar film capacitors work but will cause a larger measurement error. The dielectric absorption induces a bend in the integration slope. The bend can be removed by generating the line for a second order polynomial instead of the straight line found by linear regression.
You can perform the linearity test using the attached circuit and sketch. You will also need a serial terminal program that can capture the serial data. The captured text file is loaded into your analysis program after the first couple of text lines “Ramping Down” and “Ramping Up” are removed.
Here are some instructions for using Xcel ® to analyze the data:
1. Create a sample count index column A (series of numbers 1 to N)
2. Paste the ADC linearity text (N-values) into column B
3. Plot Column B
4. Find the 2nd order polynomial trend line for the plotted line of column B
5. Enter the equation in column C, using column A as the x value
6. Copy C1 and past into C2 through CN
7. Subtract the ADC data column B from column C and place in column D
8. Column D contains the differential linearity error
9. Make a filtered column E, e.g. E1 = SUM(A1:A7)/7
10. Copy E1 and past into E2 through EN
11. Make a scatter xy plot using column C as x and column E as y
The scatter plot is the filtered differential linearity versus ADC value 0 to 4095
The test circuit:

Attached sketch: linearity_tester_incal_comments.ino
All of the following testing is with 4 samples averaged, 16-bit single ended mode and data truncated to 12-bits.
When the internal hardware gain correction is used, the ADC has a pronounced differential linearity error of about plus and minus 2-bits. The repeated pattern of 32 times suggested there is an error between the five most significant bits and the remainder of the capacitive DAC. I tried the same test on a teensy 3.5 and a teensy 3.6. Both had the same results.
Linearity test:

With the internal gain correction value is set to 32768 (a gain of 1.0 or no correction), the differential linearity error has no notable patterns and I have measured errors as low a plus and minus a half of bit.

I have noticed the ADC data in my application contains a lot of random noise spikes. As a reminder, the time between measurements is 50us or a 20KHz rate.
The following graph is with the system set at 10mV per division. One input at ground level and the other driven with a 60Hz sine at plus and minus 20mV.

Some of the noise spikes can be removed using a nearest neighbor filter. After data is acquired, advance through the array and replace the data if the two adjacent data values are within plus and minus one bit (0.005V for my system). The data is replaced by the average of the two neighbors. The following snippet is in Pascal:
v1 := abs((v[j-1]-v[j+1]));
if (v1 < 0.008) then v[j] := (v[j-1] + v[j+1])/2;
Example of filtered data:

Using an external ADS8684 converter, this is what the signal looks like at 14-bits resolution. The DAC steps are clearly visible.


