Ello!
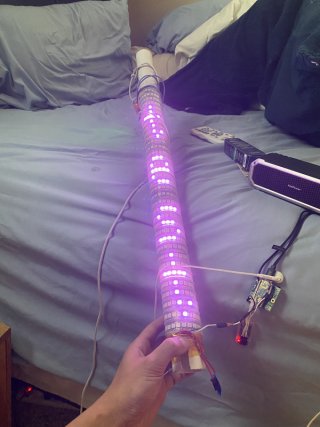
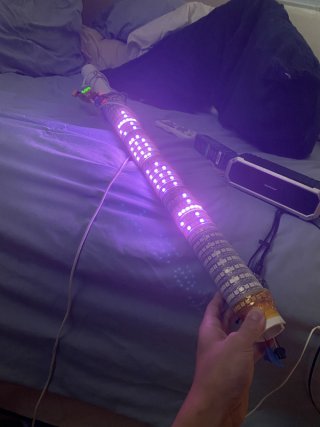
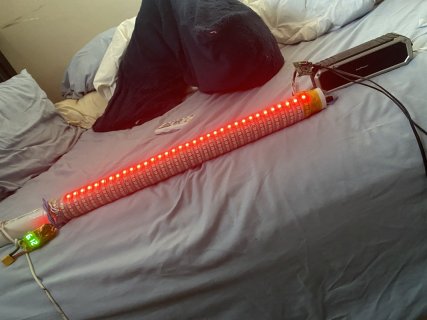
So my project atm consists of 720 neopixels wrapped around a pole. With it is attached a teensy 4 with blynk, a BLE HM-10 module, and audiosheild. I have the bulk of my project put together with the ios remote and a few visualizations working.
The idea
I want to map the leds around a pole almost as a lcd matrix. I want enough detail to be able to print text on the side of the pole. The leds are wrapped around the pole with no spacing between the wraps so there should be consistent spacing. I plan on starting with counting the number of leds to make one turn and then segment the array into strips, i doubt this will be accurate and I will probably need to manually adjust an offset for each turn of the spiral. Im a little lost on how I can map the leds as a matrix in code other than to break it apart into smaller arrays for each wrap.


