fred_france
Active member
Hello,
I made my first spectrum analyzer displayed on the ILI9341 using AudioAnalyzeFFT1024.
I would like to display the frequency axis logarithmically.
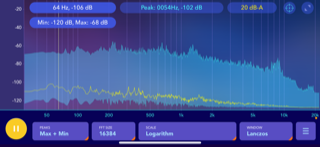
Here, for example, are the graduations:
0 - 50 - 100 - 200 - 500 - 1K - 2K - 5K - 10k - 20khz
(And in a second time the vertical axis in dB).
Here is an example of these axes taken from an IOS application (spectrum anaylser):
.PNG")
Thank you in advance for your help
I made my first spectrum analyzer displayed on the ILI9341 using AudioAnalyzeFFT1024.
I would like to display the frequency axis logarithmically.
Here, for example, are the graduations:
0 - 50 - 100 - 200 - 500 - 1K - 2K - 5K - 10k - 20khz
(And in a second time the vertical axis in dB).
Here is an example of these axes taken from an IOS application (spectrum anaylser):
Thank you in advance for your help