print cumulative histogram of measurements of analog pin via Teensy 4.x to serial

ericfont

Well-known member
I was curious to see how accurate the 12-bit ADC is on the Teensy 4.x. The pjrc product page suggests there is some limitation ("The hardware allows up to 12 bits of resolution, but in practice only up to 10 bits are normally usable due to noise") but I wanted to see if more refinement was possible by repeated samples and averaging, and how the noise distribution looked.

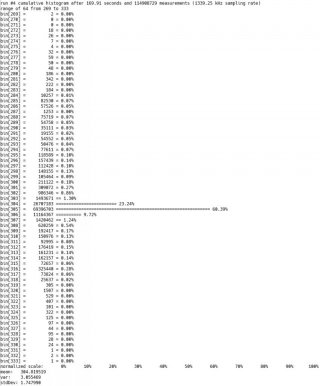
So I wrote a simple program to print out the histogram of measurements. Here is an example measuring a 5k pot at some position between 3.3v and ground, using analogReadBitDepth=12 and analogReadAveragingNum=32:

histogram-after-20-minutes.png

And here is an animation of the first 15 seconds:

15-seconds-of-histogram.gif

The accuracy of the mean seems to improve after time. (I might want to investigate more to see how quickly it converges to a specified degree of accuracy.) The noise looks roughly like it could be gaussian on first glance.

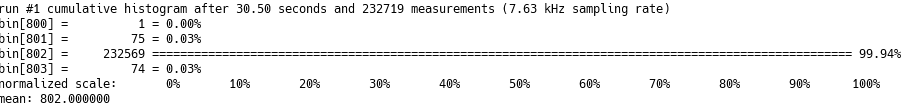
Turns out the analogRead function has a limited sampling rate...cause it seems at 12-bits I was only able to sample at 6.41 kHz (regardless of the value I used for analogReadAveragingNum). I don't know if using the advance ADC library or trying to handcode something will improve it, or if there is some hardware limit with this (( did peek at the teensy core github repo and see the function waits for some condition before making another reading). With analogReadBitDepth=10 I got 7.63 kHz sampling rate:

histogram-after-4-minutes-10-bits.png

and after even more time:

histogram-after-14-minutes-10-bits.png

As expected considering the note that "in practice only up to 10 bits are normally usable due to noise", turns out there is much less variation, though there still are some deviations probably also due to noise. With 8 bits only, the results are almost always exactly on one value or another without only the occasional variation:

histogram-after-10-seconds-8-bits.png

Here's my code: https://github.com/ericfont/teensy_...a74b2aec5b416b4fc90/histogram_measure_ADC.ino.

Note that pressing a push button on pin 0 connected to ground will trigger an interrupt to reset historgram to clear its data to start a new run of collecting samples. So if you want too change your pot position and gather new samples, then wire up a push button to pin 0 connected to ground, and press that push button after changing the pot (or whatever analog value you want to read).

If anyone knows techniques for increasing sampling rate, I might be curious. According to https://forum.pjrc.com/threads/25532-ADC-library-with-support-for-Teensy-4-3-x-and-LC there is a "Continuous" mode and a "ContinuousDifferential" mode which seems interesting...gonna look into now.
 

Attachments

  • histogram-after-30-seconds-minutes-10-bits.png
    histogram-after-30-seconds-minutes-10-bits.png
    14.4 KB · Views: 46
Last edited:
aha, well I found there's settings for Conversion speed and Sampling speed in the ADC library, and running the example "conversionSpeed" from it, I found that in Continuous mode can get can get at best .53 us on 8-bit, .64 on 10-bit, and .75 us on 12-bit. And in Single-shot mode best can get is .99 us on 8-bit, 1.12 us on 10-bit, and 1.19 us on 12-bit. I've sorted the output of that example on my teensy 4 by speed:

https://docs.google.com/spreadsheets/d/1AVG81a3CWeJ2VWcEFinKArPHD07hX6ibjdECMzZMeT4/edit?usp=sharing

So now I need to update my program tot use these conversion speed settings.
 
variance or standard deviation at this highest sampling & conversion rate at 12 bits seems to range from .32 to .56 depending on position of my 5k pot (probably the internal sampling capacitor charges differently based on the impedance...ideally I should be measuring from the output of a low impedance source like an opamp).

And I guess a lot of the variance depends on whether my pot happens to be positioned such that the mean hits right on a integer, or whether the mean falls in the middle of two integers (in which case the variance calculation is results in a much higher values, cause it looks like a bimodal distribution).
 
8-bits: 58.59 kHz max sampling rate
10-bits: 48.83 kHz max sampling rate
12-bits: 41.85 max sampling rate

That is using ADC_CONVERSION_SPEED::VERY_HIGH_SPEED and ADC_SAMPLING_SPEED::VERY_HIGH_SPEED on my Teensy 4.0. I guess that must be hitting some internal hardware limitation. Unless there is something I'm missing someone can clue me in.
 
it is worth pointing out that my earlier measurements were using averaging=32. If I only use averaging=1, then there is a much larger spread in the measurments, though can get up to 1.34 MHz sampling rate:

no-averaging-larger-spread-but-faster_.jpg
 

Attachments

  • no-averaging-larger-spread-but-faster.jpg
    no-averaging-larger-spread-but-faster.jpg
    84.1 KB · Views: 39
Comparison of frequencies & noisiness of measurements when going from averaging=32 to averaging=1 for 12-bit at highest speed:

averaging 32: 41.85 kHz, stdDev = 0.483

averaging-32.png

averaging 16: 83.70 kHz, stdDev = 0.521

averaging-16.png

averaging 8: 167.40 kHz, stdDev = 0.708

averaging-8.png

averaging 4: 334.82 kHz, stdDev = 0.918

averaging-4.png

averaging 1: 1339.25 kHz, stdDev = 1.75

averaging-1.png

I'm glad I did this, cause now I have a much better idea about how precise the measurements relative to the averaging rate. I guess depending on your desired usage you will pick a different averaging rate based on tolerable standard deviation...as there is a clear inverse relationship between precision and nAveraging.
 
Good to know at least one person found these historgrams useful!

I updated my code to use both of the hardware ADC0's on the teensy 4: https://github.com/ericfont/teensy_...c65e0f2b9602/teensy_histogram_measure_ADC.ino

I just tested with ADC0 connected to the middle of a 1 megaohm pot and ADC1 connected to the middle of that earlier 5 kohm pot, and ran the histogram for 50 minutes, and here is the result:

two-adcs-simultaneously-different-ohm-pots-1M-adc0-5k-adc1_3400seconds.jpg

First note that the 1Mohm on ADC0 has a lot more variance in the measurements than the 5 kohm on ADC1. This is as expected from theory because internally the pots have to charge a capacitor for measuring, and that charging time has a component of delay proportional to that RC delay. I did notice some interesting quick that the 1 mohm measurment histogram has something of a smaller normally distributed mode (here centered around bin[2116]) with about .01% of the measurements hit (and a few more hundreths of a percent hit around that). That is very curious...probably some odd thing happening with the charging of the measurement capacitor or the voltage supply levels. Meanwhile the 5k pot measurementts are much more tight. So I think the lesson (as expected from theory) is to use low impedance input lines going into the ADC measurement pin (for example from the output of a omp amp).

I'm also wondering if maybe want really good accuracy, could use a "sample-and-hold" ICs such as LF398, and output a clock pulse to sample the value into that LF398, and then it will hold that voltage at a constant strong level for a longer period of time over which the teensy can grab repeated measurements for arveraging. I just ordered a few of those LF398's and will provide histogram measurements when I get them on monday.
 
I decided to generate a couple histograms with the most extreme resistor values I had...

between two 10 ohm resistors dividing the 3.3v supply (yes I am aware this draws quite a lot of current, however I am not drawing anything else and what just doing a quick measurement):

View attachment 26414

between two 1 Mohm resistors dividing the 3.3v supply (results in a huge amount of variance in the measurements

View attachment 26415
 
out of curisity, I did another measurement now, this time having both ADCs set to the same settings and measuring the same analog value (both are connected to the middle of two 1k ohm resistors dividing 3.3v supply)...and the results are interesting...it seems the first adc has a much more stable value (stddev = 1.39) while the second ADC has more variance (stddev=1.80) and seems to have a second mode in the hisotogram a bit higher than the more accurate center that the first adc measured.

test-two-adcs-measuring-same-analog-value-between-two-1kohm-resistors-dividing-3v.jpg

(I sortof expected the result to be bad... probably has to do with the first ADC's capacitor being able to charge properly while the second ADC capacitor gets a the leftovers)
 
(there might be some trick to be able to alternate charging each capacitor, which might alleviate this issue with the second ADC getting a weaker charge)
 
I'm investigating how having each ADC on different configuration affects the precision... Something interesting is that it always seems that ADC0 is much more accurate than ADC1 regardless of the settings. I am in "continuous mode"...so I'm wondering if maybe it is a bad idea to use both ADCs in continuous mode....or maybe if use both then use ADC0 for data that needs precision and leave ADC1 for data that you aren't worried about precision nearly as much. For instance, here is BitDepht=12, averaging=8, @23.4Khz, both sampling and conversion at low speed):

both-low-sampling-and-conversion-speed-and-8-averaging.png

And that spread on ADC1 is way higher than one. both are measuring the middle of their own separate 2kohm voltage divider between 3.3v and gnd.
 
Something interesting is that it always seems that ADC0 is much more accurate than ADC1 regardless of the settings...

Actually I did some more testing and found that if I use a 100 nF capacitor from the input pin to ground and a 100 nF capacitor from the input ground to 5V, then I was able to reduce a lot of the noise (my stdev stat seems to drop in half) and the stdev was consistent on all pin when I did this. And actually the reason I mistakenly believed different pins gave different noise was because I was actually using a longer wire to measure. So the lesson to learn is if you want lowest noise measurement then use caps and a shorter wire to source (oh and it helps a ton if use a buffered output of an op amp or a sample-and-hold such as LF398) so that the signal is strong and stable going into the pin.
 
there is a clear inverse relationship between precision and nAveraging
Useful rule of thumb: if the distribution is Gaussian, the standard deviation of the average is proportional to 1/sqrt(N) where N is the number of points averaged.
 
Unfortunately that square root has consequences. To get ten times the precision (i.e. one more digit after the decimal point), you have to average 100 times as many data points.
 
ahh...thanks for the insight. So I guess plugging that equation in...with averaging of 32 I guess can theoretically expect noise to be only about 17.7% of original.
 
for my personal reference I made a spreadsheet of the theory: https://docs.google.com/spreadsheets/d/1gxDhfphANvj7ONVUtJC7trOOcw9ze7UgZbRN2VchckU/edit?usp=sharing

And made a chart from that:
how standard deviation of noise changes when increasing averaging of samples containing gaussian.jpg

https://docs.google.com/spreadsheet...vDL/pubchart?oid=166100424&format=interactive

I guess the take-away is that the benefit from averaging is much larger when starting to do averaging, but has significantly diminishing marginal returns... Gets to 30% of original with just ~12 samples, then 20% of original with just ~28 samples, but then gets to %10 of original with 100 samples, then 5% of original with 500 samples, and then asymptotically approach 0.
 
thinking about the 1/sqrt(n) phenomenon in terms of bits of reduction of the standard deviation:

To get a 1-bit reduction, would need 4 samples (1/sqrt(4) = 1/2 = 1/(2^1) = 50%).
To get a 2-bit reduction, would need 16 samples (1/sqrt(16) = 1/4 = 1/(2^2) = 25%).
To get a 3-bit reduction, would need 64 samples (1/sqrt(64) = 1/8 = 1/(2^3) = 12.5%).
To get a 4-bit reduction, would need 256 samples (1/sqrt(256) = 1/16 = 1/(2^4) = 6.25%).
To get a 5-bit reduction, would need 1024 samples (1/sqrt(1024) = 1/32 = 1/(2^5) = 3.125%).
 
so each addition bit of reduction requires 4x more samples to average. Out of curiosity, hypothetically thinking about how much time that would require on with the 1.34 MHz sampling rate...here's spreadsheet output:

column 1: desired reduction in standard deviation in bits
column 2: number of samples required
column 3: time in seconds to take all those samples at 1339.25 kHz sampling

1 4 0.000002986746313
2 16 0.00001194698525
3 64 0.00004778794101
4 256 0.000191151764
5 1024 0.0007646070562
6 4096 0.003058428225
7 16384 0.0122337129
8 65536 0.0489348516
9 262144 0.1957394064
10 1048576 0.7829576255
11 4194304 3.131830502
12 16777216 12.52732201
13 67108864 50.10928803
14 268435456 200.4371521
15 1073741824 801.7486085
16 4294967296 3206.994434
17 17179869184 12827.97774
18 68719476736 51311.91095
19 274877906944 205247.6438
20 1099511627776 820990.5752
21 4398046511104 3283962.301
22 17592186044416 13135849.2
23 70368744177664 52543396.81
24 281474976710656 210173587.2
25 1.1259E+15 840694349
26 4.5036E+15 3362777396
27 1.80144E+16 13451109583
28 7.20576E+16 53804438333
29 2.8823E+17 215217753333
30 1.15292E+18 860871013333
31 4.61169E+18 3443484053334
32 1.84467E+19 13773936213336

So an 4-bit reduction takes a fifth of a millisecond, a 8-bit reduction takes ~50 milliseconds, a 16-bit reduction takes 54 minutes, a 24-bit reduction takes 6 years & 8 months, and a 32-bit reduction would take half-a-million years.
 
For a practical consideration, if the desired application is 20 kHz audio, then could over-sample 32 times at 1339.25 kHz to produced an averaged 41.85 kHz audio sample, which would only give 17.68% reduction (or somewhere between 2-bits and 3-bits of reduction) of the standard deviation.

Or if targeted 10 kHz audio, then could over-sample 64 times to produce an averaged 20.9 kHz audio sample, and that would reduce the standard deviation by 3-bits exactly.

So unfortunately if we accept from the datasheet that only ~10-bits of the 12-bit ADC samples are really usable due to noise, then 10 kHz audio could only get roughly 13-bit resolution above the noise floor, and 20 kHz audio couldn't even quite reach 13-bit resolution above the noise floor. So nowhere near CD quality is possible with just simple averaging of raw samples on Teensy 4, (without more advanced methods).

(*these are all just rough back-of-envelope calculations I'm pondering to myself*)
 
Back
Top