Context:
I’m creating an audio network analyser based around a Teensy 3.2. It generates a range of frequencies (20Hz - 20kHz) which are fed into a Device Under Test (DUT), then measures the output to see how the DUT is attenuating or boosting particular frequencies. It does this several times, actuating a knob on the DUT between each set of measurements. This functionality is working well, but just dumping data via Serial.print().
Goal:
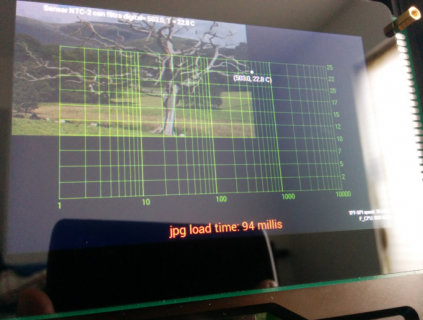
For ease of use, I want a signal response graph (example below) to be generated once all measurements have been made. It needs to have a logarithmic x-axis, and be able to display several curves. I’ve done some googling but don’t really know what I’m looking for. It’s fine if the Teensy stays connected to a laptop, or displaying on a standalone screen would be great too, if it doesn’t add too much software complexity.

Questions:
What options would people recommend for generating and displaying a line graph with Teensy 3.2? I’ve heard Processing recommended for use with Arduino, would this be a good method? Or, would it be hard to generate everything on the Teensy and display it on small LCD / OLED? How would this be achieved? Any suggestions would be really appreciated, I'm a bit lost.
I’m creating an audio network analyser based around a Teensy 3.2. It generates a range of frequencies (20Hz - 20kHz) which are fed into a Device Under Test (DUT), then measures the output to see how the DUT is attenuating or boosting particular frequencies. It does this several times, actuating a knob on the DUT between each set of measurements. This functionality is working well, but just dumping data via Serial.print().
Goal:
For ease of use, I want a signal response graph (example below) to be generated once all measurements have been made. It needs to have a logarithmic x-axis, and be able to display several curves. I’ve done some googling but don’t really know what I’m looking for. It’s fine if the Teensy stays connected to a laptop, or displaying on a standalone screen would be great too, if it doesn’t add too much software complexity.
Questions:
What options would people recommend for generating and displaying a line graph with Teensy 3.2? I’ve heard Processing recommended for use with Arduino, would this be a good method? Or, would it be hard to generate everything on the Teensy and display it on small LCD / OLED? How would this be achieved? Any suggestions would be really appreciated, I'm a bit lost.