
You are using an out of date browser. It may not display this or other websites correctly.
You should upgrade or use an alternative browser.
You should upgrade or use an alternative browser.
New Teensy 4.1 DIY Synthesizer
- Thread starter Rolfdegen
- Start date
fdaniels
Well-known member
Why do you have a physical bass boost? If you feel you are lacking low end you could either implement a Sub Oscillator (good idea anyways) or ad a bit digitally (via adding HP output from a SVF to the Sum at the end of the Chain). BTW, better use a BiPolar Electrolytic Cap for decoupling, see here: https://mutable-instruments.net/archive/schematics/Shruthi-Analog-SMR4-mkII-v02.pdf
Might be that this already solves your Problem.
Might be that this already solves your Problem.
fdaniels
Well-known member
People will hate you for that DC offset. At least many people i know.Thanks for your tips. Shruthi uses symmetrical supply voltage. I want to do without that.
Time to think about your gain staging. Or your Monitors ;-)I want higher output level for bass sound. Teensy mixers and effects overdrive with bass sound.
Last edited:
fdaniels
Well-known member
Time to think about your Gain Staging if you overdrive something.
Rolfdegen
Well-known member
Hallo friend..
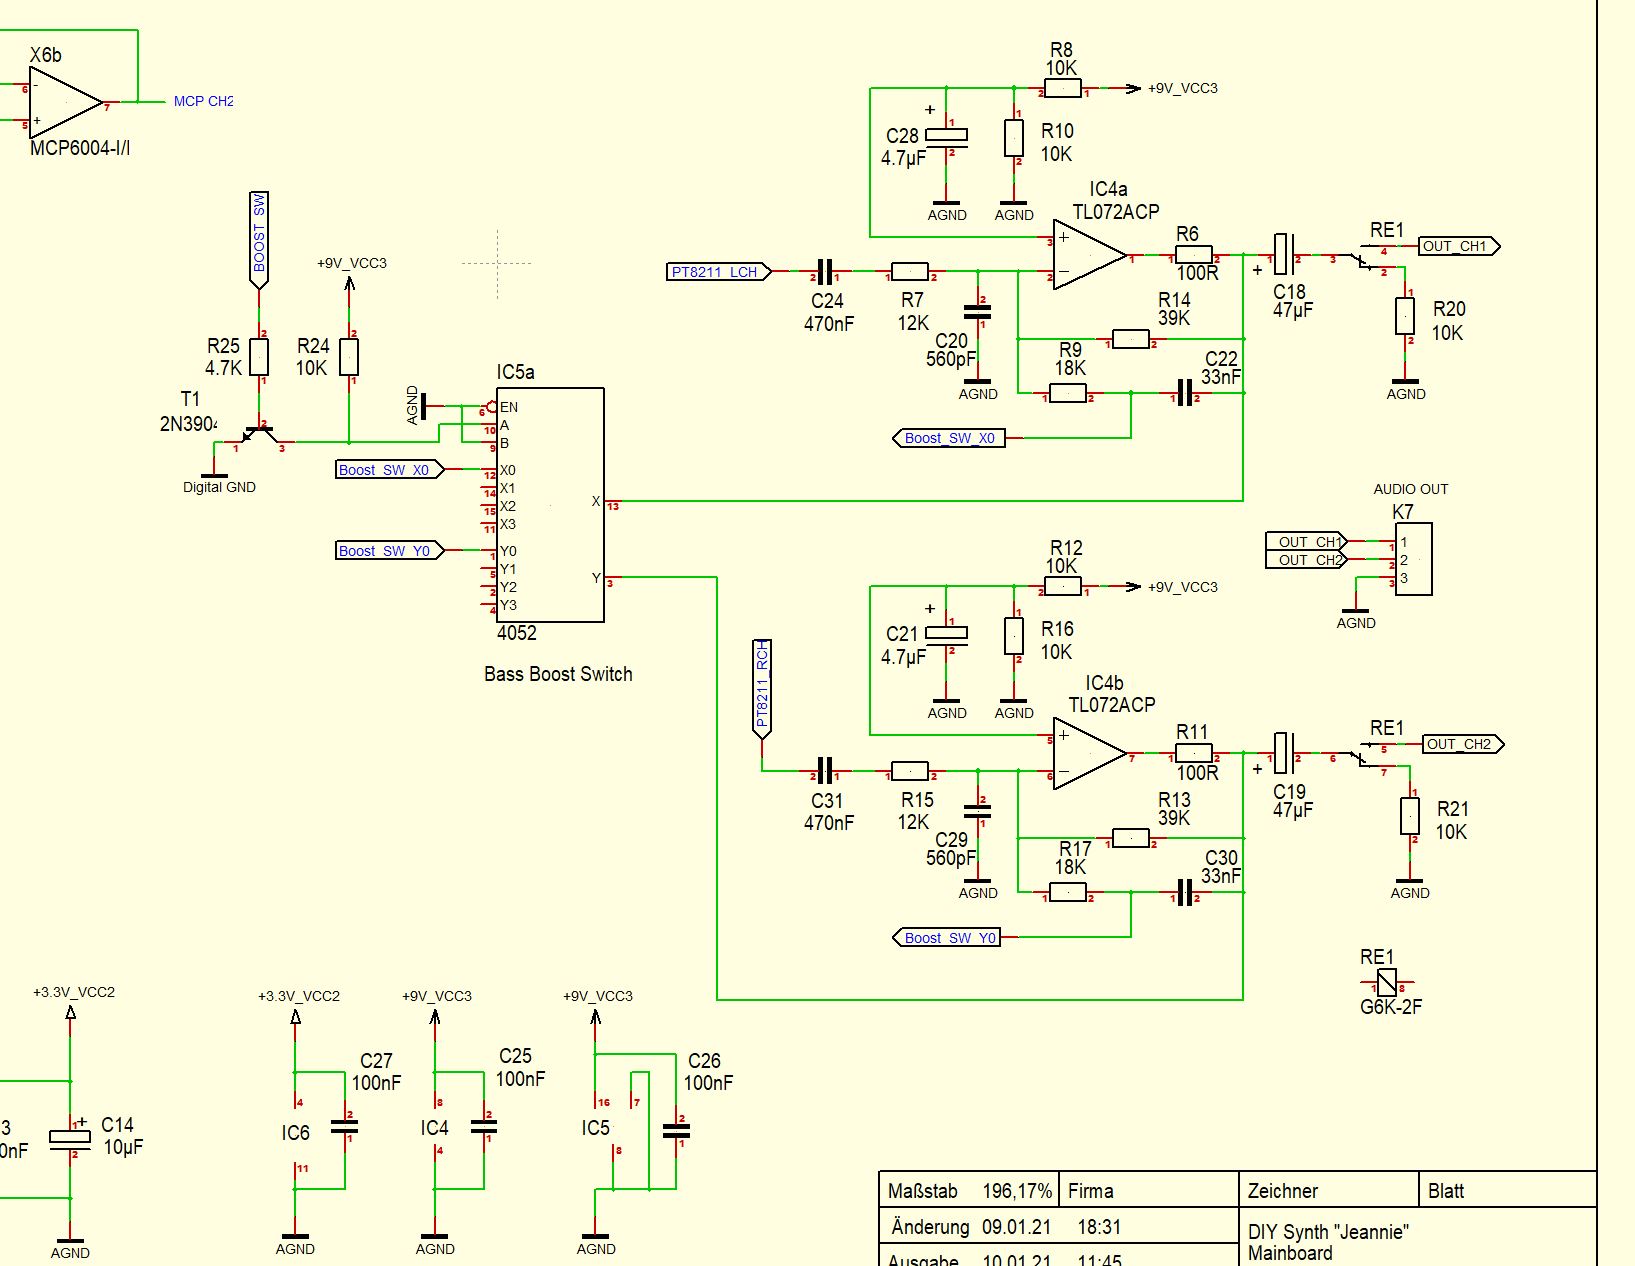
I have now built a new BassBoost circuit for my Synth. Works very well.
You now have the option, by assigning the free switching contacts on IC5a with other resistors R9/R17.
change the strength of the BassBoost. I would then also need a 2nd port line on Teensy
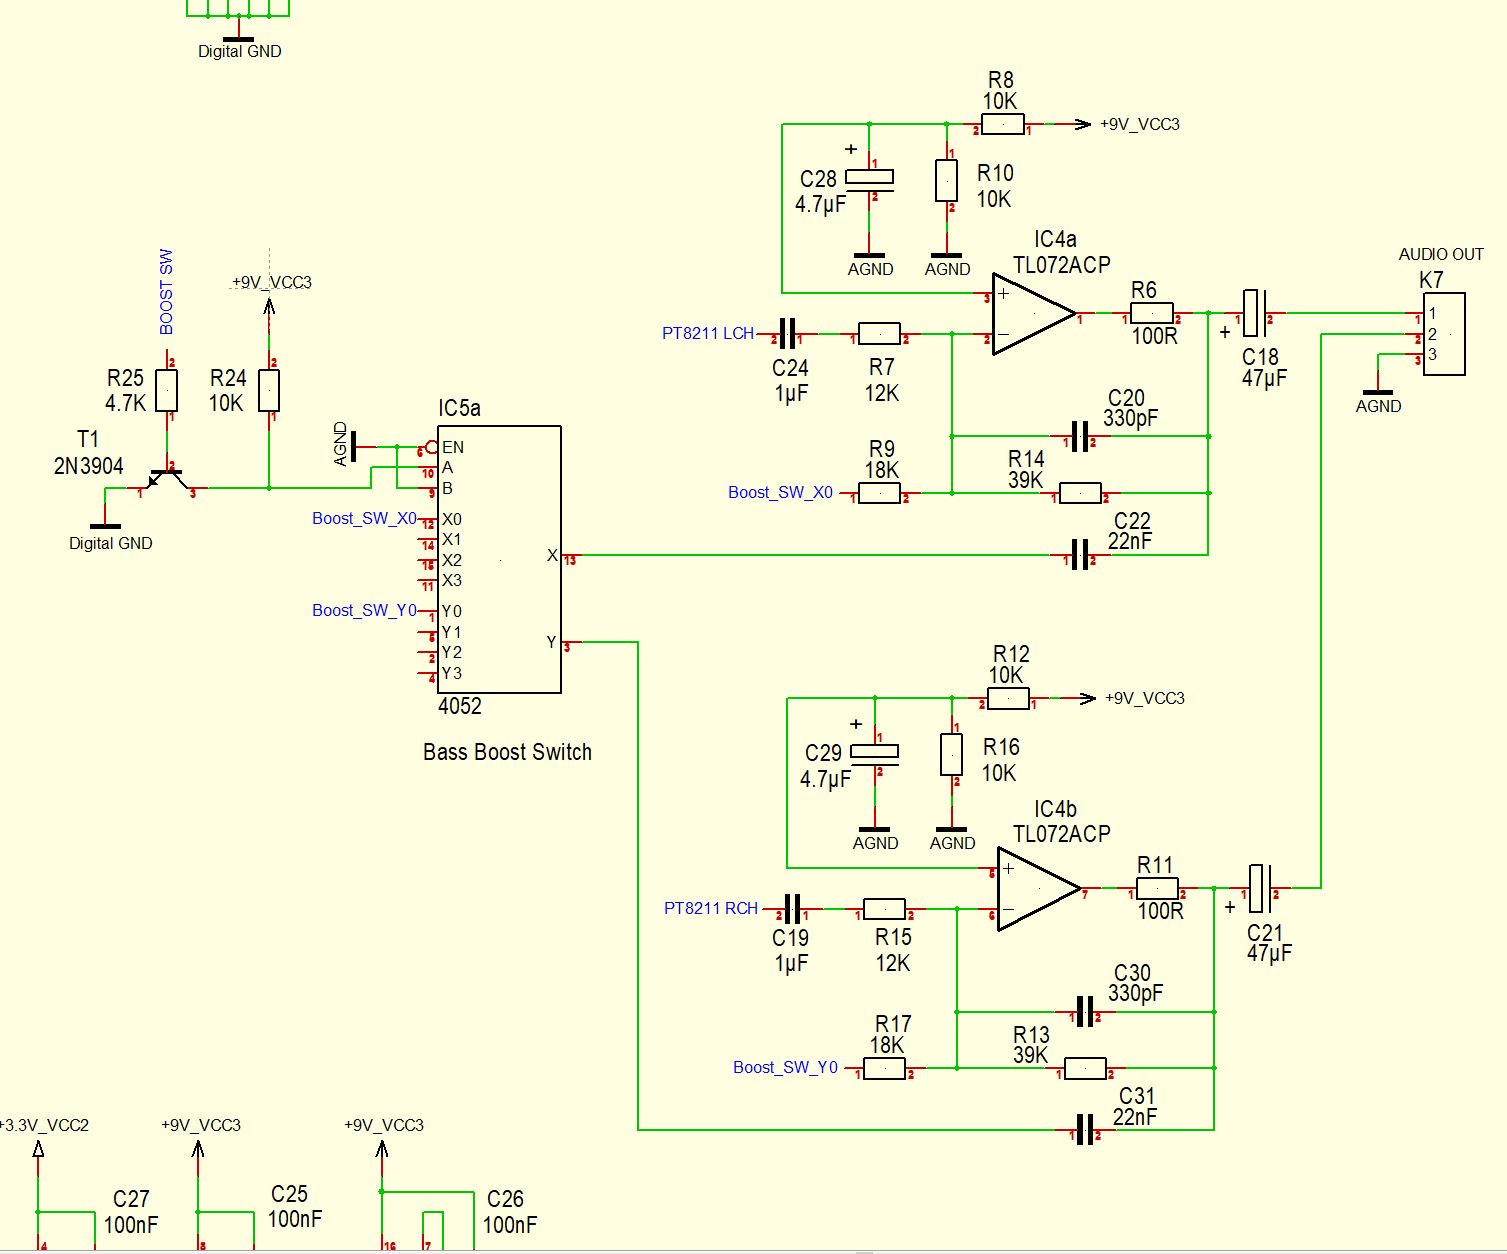
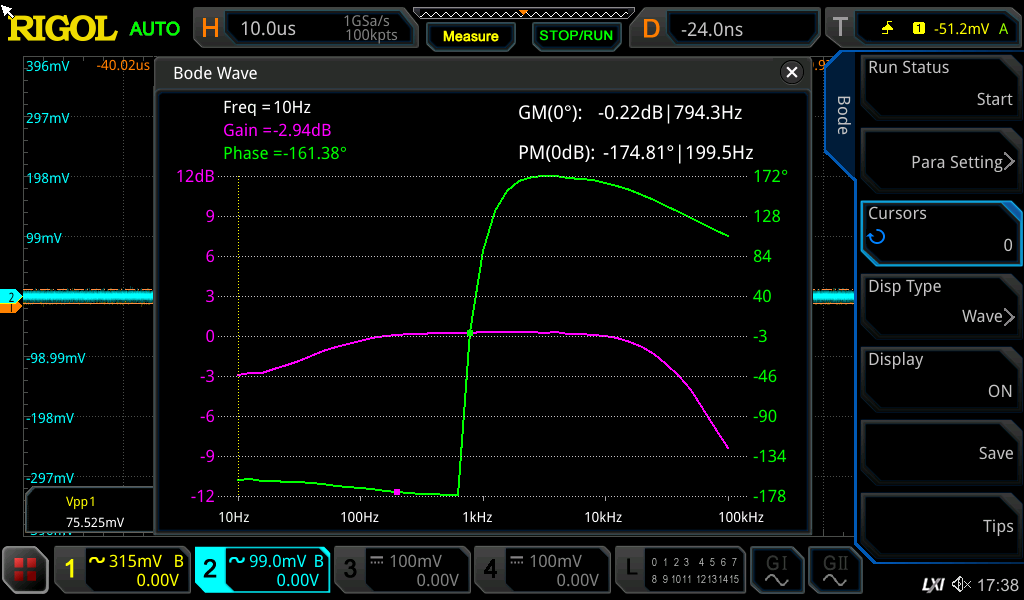
Bode Diagramm

Greetings Rolf
I have now built a new BassBoost circuit for my Synth. Works very well.
You now have the option, by assigning the free switching contacts on IC5a with other resistors R9/R17.
change the strength of the BassBoost. I would then also need a 2nd port line on Teensy
Bode Diagramm
Greetings Rolf
Last edited:
A bleeder resistor to ground on the outputs will ensure the output capacitors get charged up properly and avoid the loud crack/thump
on plugging them into some external amplifier. Something like 10k ought to do it.
You can't git rid of a thump if the system is connected up and then powered up, due to the asymmetric rails, however.
on plugging them into some external amplifier. Something like 10k ought to do it.
You can't git rid of a thump if the system is connected up and then powered up, due to the asymmetric rails, however.
Rolfdegen
Well-known member
Hallo friends..
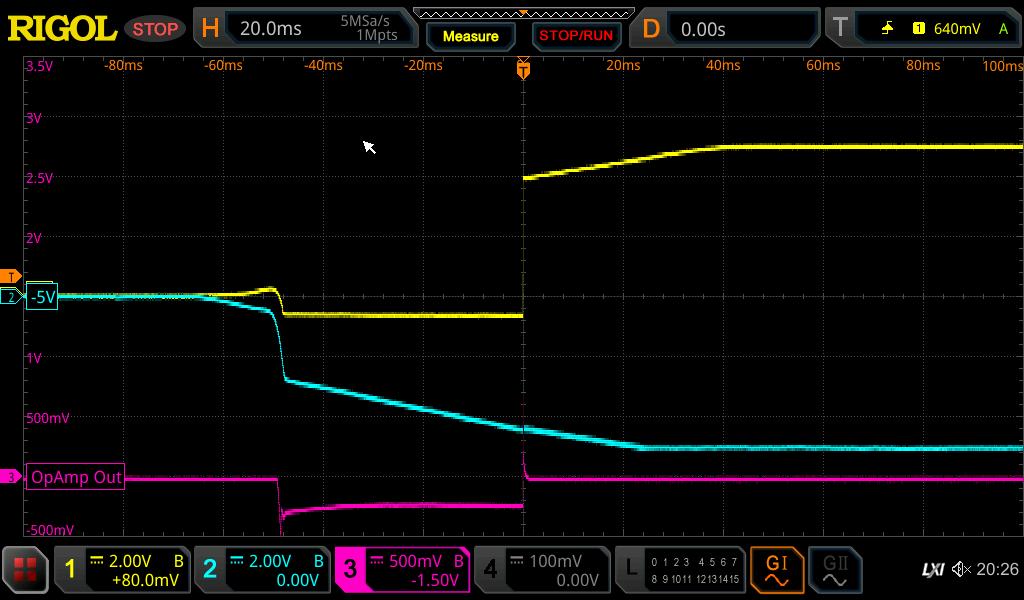
Small measurement setup with TL072 and symmetrical power supply.
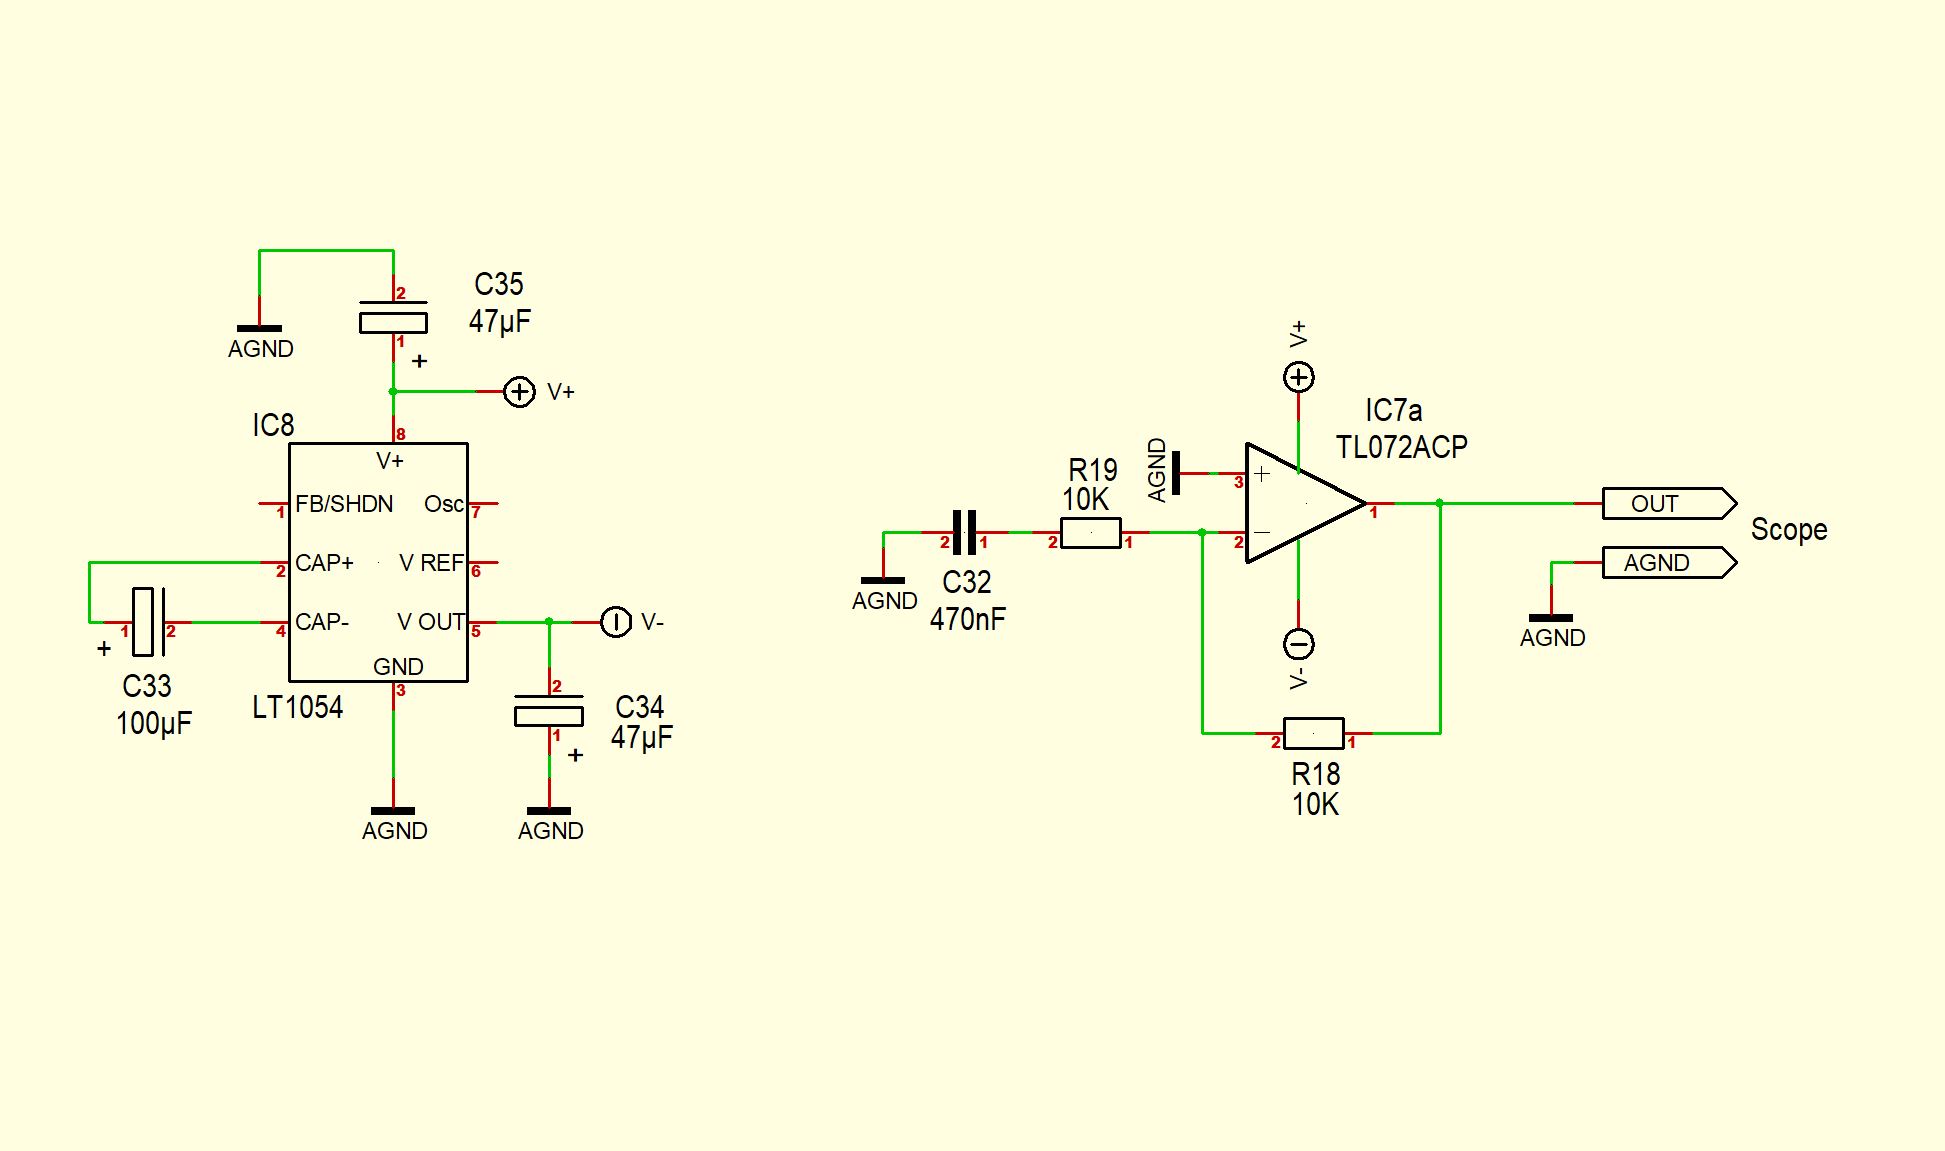
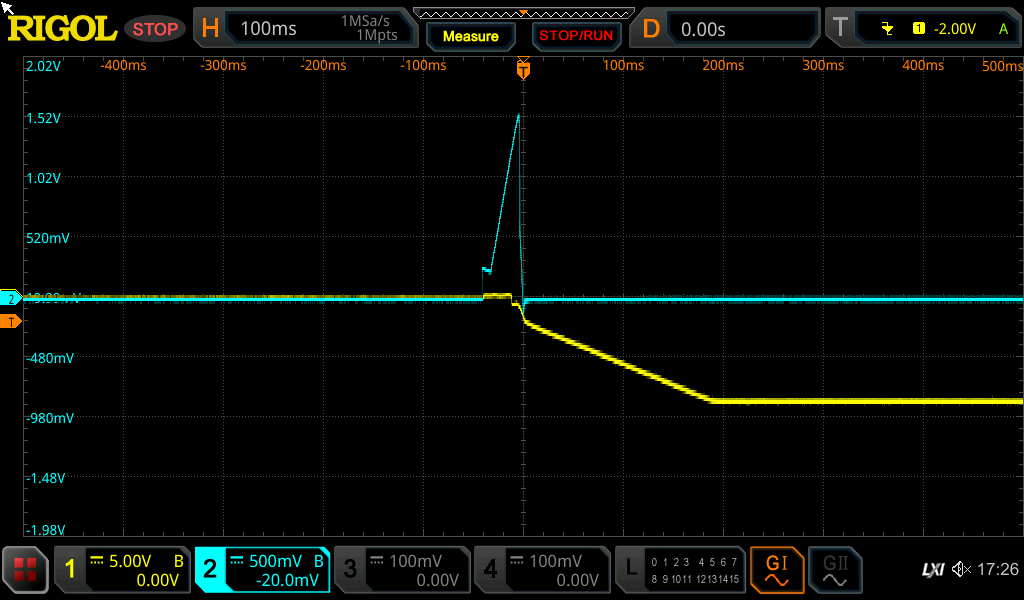
Blue the output voltage at the TL072. Yellow the -9V voltage on the TL1054.
There is also a switch-on pulse. I think the best way is an mini relay e.g. https://www.reichelt.de/ultra-minia...Niw5ZxvOXT5fITQH-C3Nv2G7GF16gi_RoCHgoQAvD_BwE
Enclosed pics. Greetings Rolf
Small measurement setup with TL072 and symmetrical power supply.
Blue the output voltage at the TL072. Yellow the -9V voltage on the TL1054.
There is also a switch-on pulse.
I think the best way is an mini relay e.g. https://www.reichelt.de/ultra-minia...Niw5ZxvOXT5fITQH-C3Nv2G7GF16gi_RoCHgoQAvD_BwEEnclosed pics. Greetings Rolf
Rolfdegen
Well-known member
When the operating voltage is switched on, the capacitor C18 / C19 is charged via the resistor R20 / R21.
This prevents a switch-on pop at the output. After 500ms the relay is switched to the audio output.
Teensy monitors the voltage from the power supply. If it sinks, the Teensy could switch off the relay before there is a switch-off plop on connected amplifiers.
This prevents a switch-on pop at the output. After 500ms the relay is switched to the audio output.
Teensy monitors the voltage from the power supply. If it sinks, the Teensy could switch off the relay before there is a switch-off plop on connected amplifiers.
fdaniels
Well-known member
Its easy: every time you connect something (quick enough.... see here "Why do some synths produce clicks") and there is a voltage difference it clicks. It doesnt matter if you connect it via plugging in or a relay - its the voltage difference that counts. So if you use an non-symmetrical psu it will click in any way, as your voltage for "silence" is not 0V, your output will swing around Vcc/2. Only with symmetric power chances are that "silence" on your output is 0V that should be equal to GND. And GND should be at the same level in your synth AND your mixer. If not, it will click anyways. Thats the reason for real symmetric inputs on professional consoles (the ones with the matched transformers on the inputs, not these "servo symmetric" op amp lookalikes!).
To cut a long story short: this relay approach is most likely nonfunctional. But may be a USP, though.
To cut a long story short: this relay approach is most likely nonfunctional. But may be a USP, though.
Rolfdegen
Well-known member
Hello loving Teensy friends.
I changed the output amplifier and power supply a bit.The amplifier had too much interference from the 9V supply at the output.
For this reason I now use a 12V power supply and sieve the 9V supply for the amplifier.
The low pass filter at the input of the amplifier limits the maximum output frequency to 23 KHz.
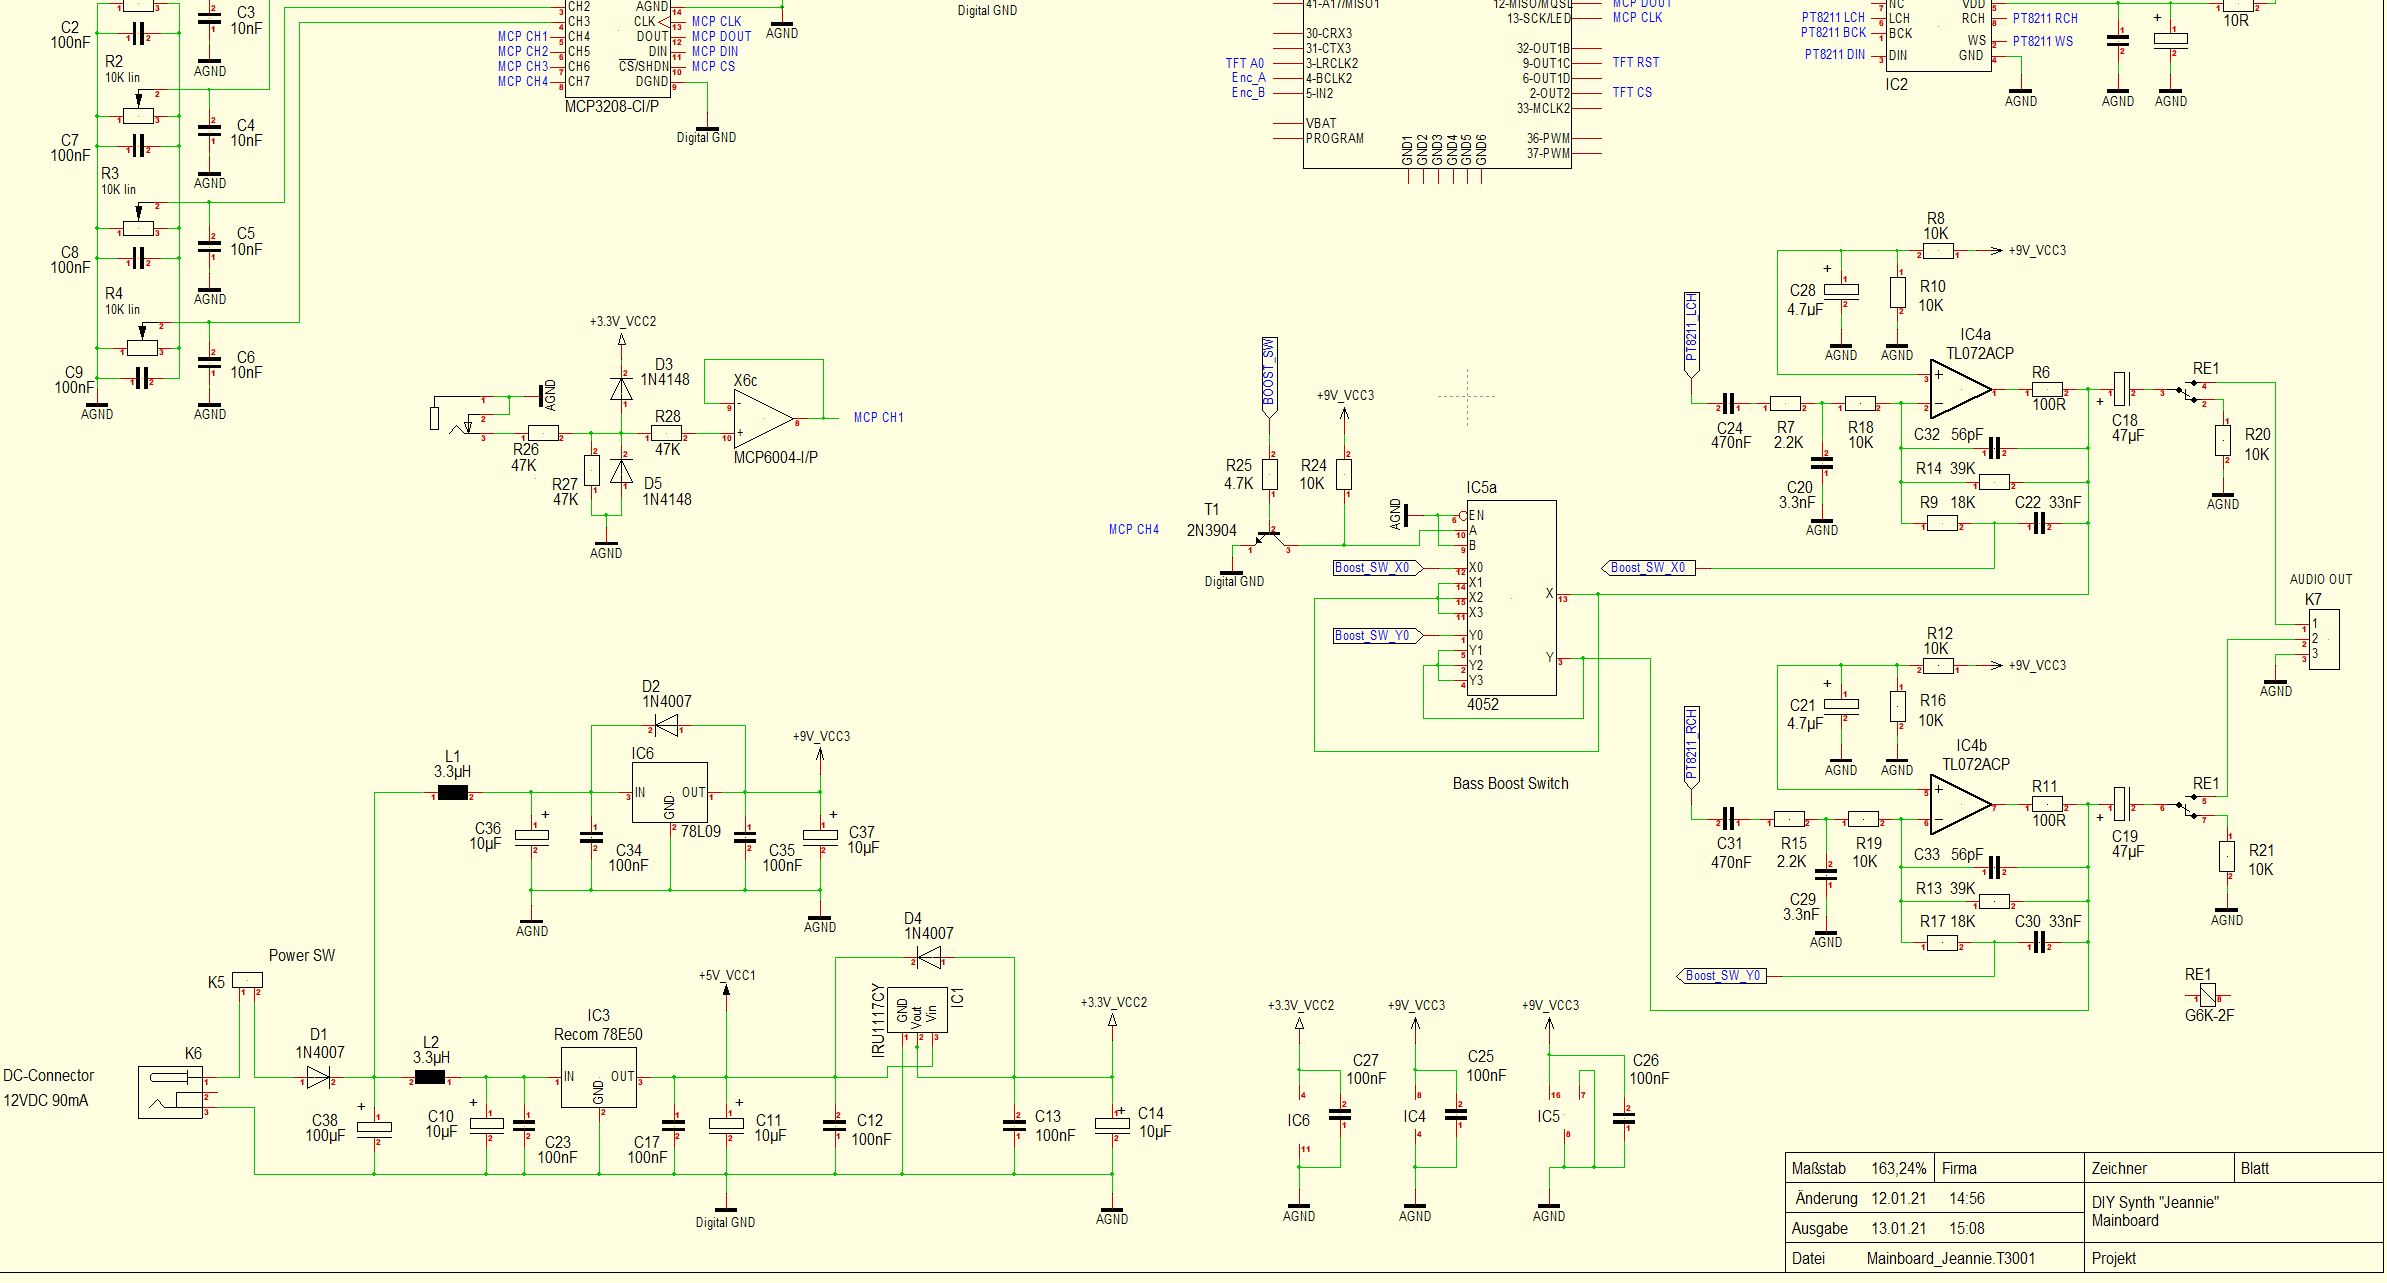
BassBoost aktiv

Greetings. Rolf
I changed the output amplifier and power supply a bit.The amplifier had too much interference from the 9V supply at the output.
For this reason I now use a 12V power supply and sieve the 9V supply for the amplifier.
The low pass filter at the input of the amplifier limits the maximum output frequency to 23 KHz.
BassBoost aktiv
Greetings. Rolf
Rolfdegen
Well-known member
I recorded a few more test sounds from my JEANNIE. All with active boost
Audio file: https://drive.google.com/file/d/1cNen9axOS54KOhjGq50l2iQ2f6VHPUtq/view?usp=sharing
Greetings. Rolf
Audio file: https://drive.google.com/file/d/1cNen9axOS54KOhjGq50l2iQ2f6VHPUtq/view?usp=sharing
Greetings. Rolf
Rolfdegen
Well-known member
Hallo friends..
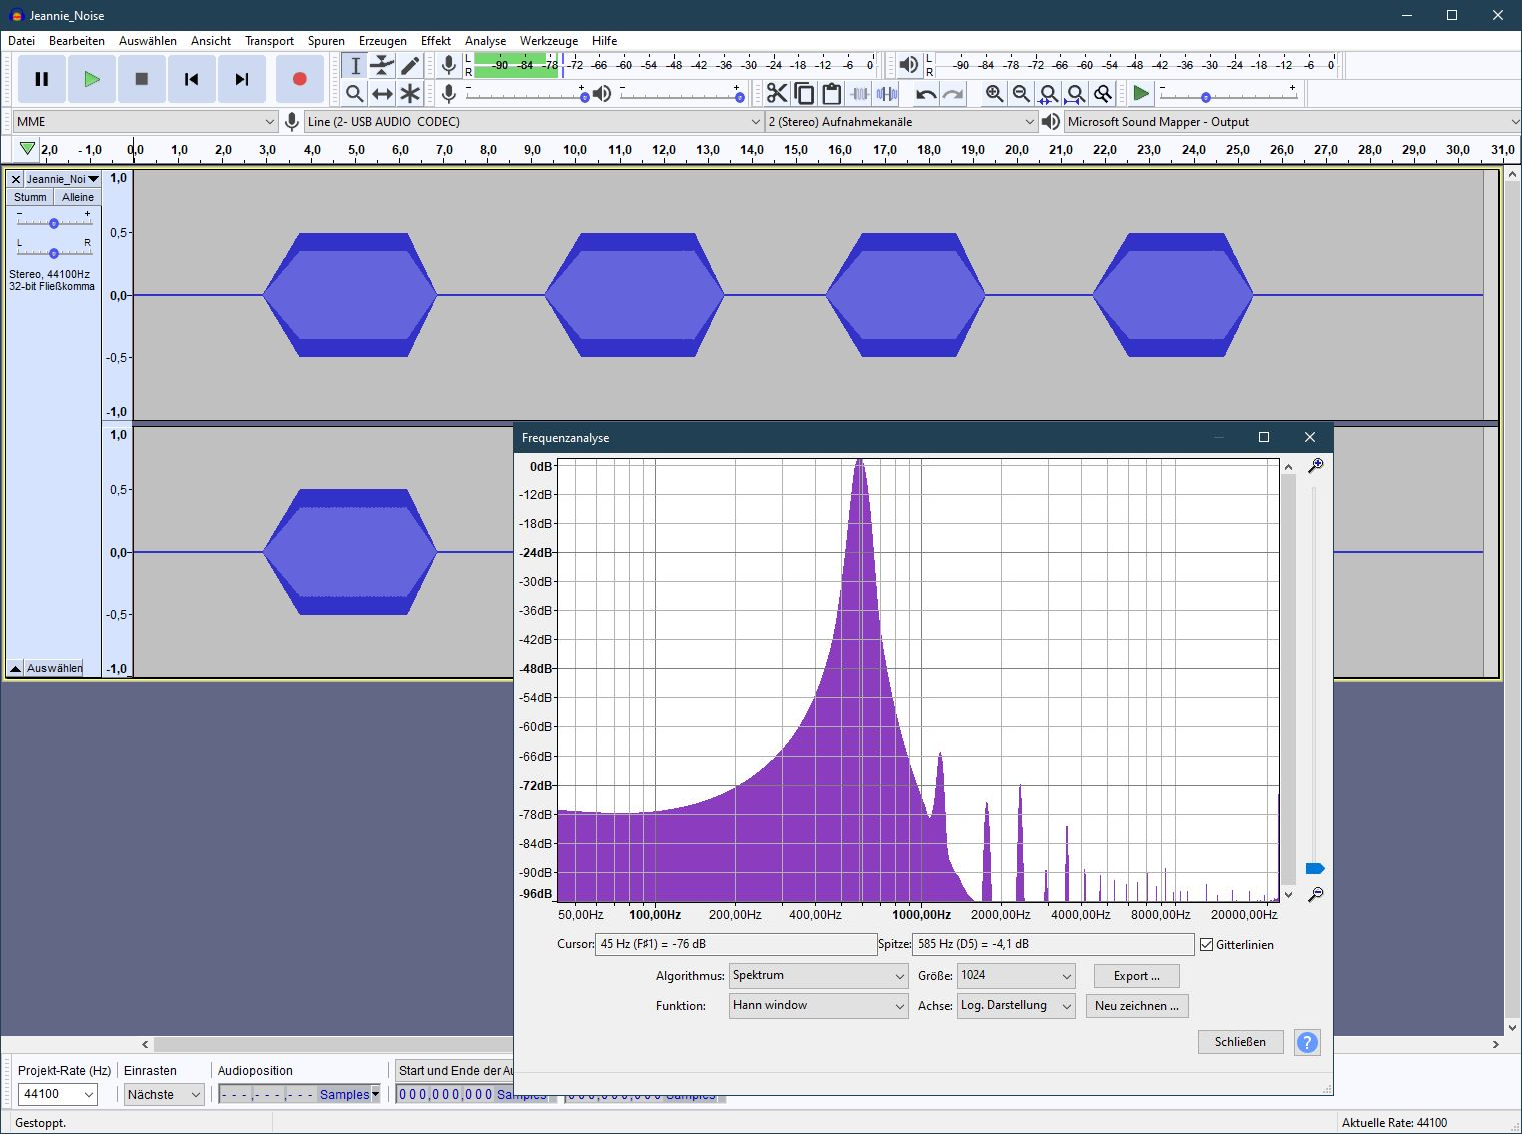
Today i makes a Noise and interference level measurement by Jeannie.
My Behringer Mixer Xenyx QX1222 makes more noise. Jeannie is better than -78dB noise.
Audio File: https://drive.google.com/file/d/16VGk8VmdS9X14xwp7R1u1UnBTZsppA5b/view?usp=sharing
Greetings from germany. Rolf
Today i makes a Noise and interference level measurement by Jeannie.
My Behringer Mixer Xenyx QX1222 makes more noise. Jeannie is better than -78dB noise.
Audio File: https://drive.google.com/file/d/16VGk8VmdS9X14xwp7R1u1UnBTZsppA5b/view?usp=sharing
Greetings from germany. Rolf
Noise floor is measured as power spectral density, that plot is showing the power spectrum w.r.t. the loudest tone, so the
-78dB isn't meaningful as a measure of noise, since changing the FFT number of points will shift it up and down as the bins change size.
I've a Python tool for analyzing sound files, and displays the spectrum with scales for both power spectrum and power spectral density,
with 0dB representing a full-scale sinewave (just before the samples would clip, basically).

I measure the PSD at low frequencies as about -115dB/Hz and the mains hum as a spectral peak at -90dB. The tone itself is -6dB, so the
mains hum is -84dB down. Audacity's plot spectrum uses +6dB for a full-scale sine wave, so my dB are basically 6dB less than Audacity's.
If the noise floor were -115dB/Hz across the audio band (20kHz) that would be a total noise power of -72dB (or -66dB compared to the tone).
Your plot with only a 1024 point FFT has large bins of 43Hz width and is completely unable to resolve the mains peak, and the skirts of
the Hann window's spectral leakage are obscuring a lot.
Try 4096 point FFT and a window like Blackman-Harris that has more contained spectral leakage and you'll see that -78dB is purely an
artifact of your FFT and window.
-78dB isn't meaningful as a measure of noise, since changing the FFT number of points will shift it up and down as the bins change size.
I've a Python tool for analyzing sound files, and displays the spectrum with scales for both power spectrum and power spectral density,
with 0dB representing a full-scale sinewave (just before the samples would clip, basically).
I measure the PSD at low frequencies as about -115dB/Hz and the mains hum as a spectral peak at -90dB. The tone itself is -6dB, so the
mains hum is -84dB down. Audacity's plot spectrum uses +6dB for a full-scale sine wave, so my dB are basically 6dB less than Audacity's.
If the noise floor were -115dB/Hz across the audio band (20kHz) that would be a total noise power of -72dB (or -66dB compared to the tone).
Your plot with only a 1024 point FFT has large bins of 43Hz width and is completely unable to resolve the mains peak, and the skirts of
the Hann window's spectral leakage are obscuring a lot.
Try 4096 point FFT and a window like Blackman-Harris that has more contained spectral leakage and you'll see that -78dB is purely an
artifact of your FFT and window.