CorBee
Well-known member
SGTL5000 tests Part5: REFCTRL and median Noise
Noise in the silent sections
After splitting the wav-files into signal and "silence" I calculated the median and the 5%,95% percentiles of the "silence" to get an idea of the bandwidth of the noise.
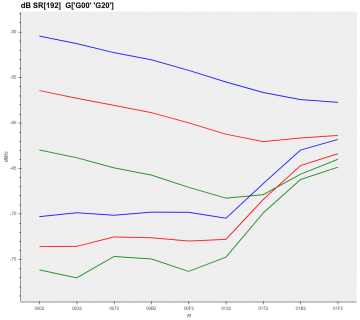
The above image shows for a single samplerate (192K) and two diffferent gains (GAIN=0, GAIN=20) these bands (blue=95%, red=median, green=5%). On the X-axis the settings for REF_CTRL can be seen (rightmost is the default 01F2). The lowest 3 lines correspond to a GAIN of 0 and show that the lower REF_CTRL until 0132 settings deliver at least 5dB less noise. The other set of lines shows a completely different pattern where the lower REF_CTRL settings produce a stronger background-signal. For GAIN=20 the band is also far wider at the lower REF_CTRL settings.
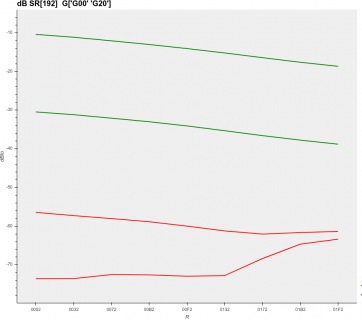
This image shows signal-strength(green) and the median-noise (red, the same as in the 1st graph) for the same settings (192K, GAIN=0, GAIN=20) of REF_CTRL.
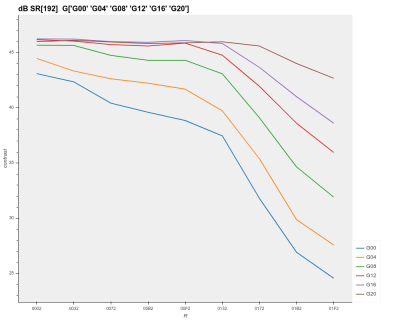
And the results can than be used to calculate the difference (or contrast) between the strength of the signal (dB) and the median "silence" in dB for all tested GAIN settings between 0 and 20. This reveals a clear pattern, at lower GAINs changing REF_CTRL to a lower value increases the contrast between the signal and the "silence". For GAIN=20 this difference is only a few dB but at GAIN=0 this difference is a lot bigger.
But this is not simply the same for all samplerates !
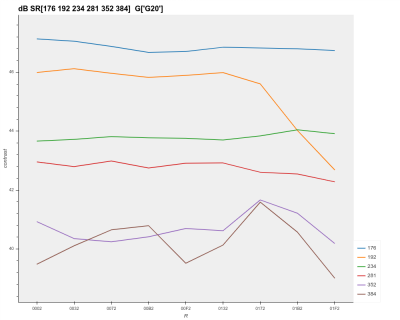
This image shows the contrast between signal/silence for GAIN=20 and all tested samplerates. For most sample-rates this more or less is stable, changing REF_CTRL at GAIN20 thus increases both signal and "silence" in an alike manner. Also notice that the contrast is ordered by samplerate, the lowest samplerate delivers the best contrast.
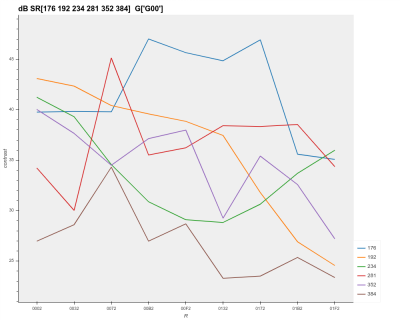
The same image for GAIN=0, the response is very different for samplerates and REF_CTRL. No clear conclusion can be drawn based on this graph. When I saw these graphs at first I was wondering if the recordings were OK. But after looking at a few spectrograms I suddenly saw that there were always frequency bands in the "silent" part of the recording. Oddly enough the location of these noise-bands was not static (as I was expecting) but they were drifting based on the changes in samplerate/REF_CTRL and GAIN. So the changes in the average noise we saw thusfar are partially due to the fact that one or more of these bands suddenly appeared/disappeared in the spectrum.
So ... the results look inconclusive and show that one can be easily tricked into seeing "hopeful" results when not all settings are tested in a standardized way. In the next part of this story I will try to show another way of looking at the noise. For that I will not be using the silence but only the recorded signal and testing for harmonics.
Noise in the silent sections
After splitting the wav-files into signal and "silence" I calculated the median and the 5%,95% percentiles of the "silence" to get an idea of the bandwidth of the noise.

The above image shows for a single samplerate (192K) and two diffferent gains (GAIN=0, GAIN=20) these bands (blue=95%, red=median, green=5%). On the X-axis the settings for REF_CTRL can be seen (rightmost is the default 01F2). The lowest 3 lines correspond to a GAIN of 0 and show that the lower REF_CTRL until 0132 settings deliver at least 5dB less noise. The other set of lines shows a completely different pattern where the lower REF_CTRL settings produce a stronger background-signal. For GAIN=20 the band is also far wider at the lower REF_CTRL settings.

This image shows signal-strength(green) and the median-noise (red, the same as in the 1st graph) for the same settings (192K, GAIN=0, GAIN=20) of REF_CTRL.

And the results can than be used to calculate the difference (or contrast) between the strength of the signal (dB) and the median "silence" in dB for all tested GAIN settings between 0 and 20. This reveals a clear pattern, at lower GAINs changing REF_CTRL to a lower value increases the contrast between the signal and the "silence". For GAIN=20 this difference is only a few dB but at GAIN=0 this difference is a lot bigger.
But this is not simply the same for all samplerates !

This image shows the contrast between signal/silence for GAIN=20 and all tested samplerates. For most sample-rates this more or less is stable, changing REF_CTRL at GAIN20 thus increases both signal and "silence" in an alike manner. Also notice that the contrast is ordered by samplerate, the lowest samplerate delivers the best contrast.

The same image for GAIN=0, the response is very different for samplerates and REF_CTRL. No clear conclusion can be drawn based on this graph. When I saw these graphs at first I was wondering if the recordings were OK. But after looking at a few spectrograms I suddenly saw that there were always frequency bands in the "silent" part of the recording. Oddly enough the location of these noise-bands was not static (as I was expecting) but they were drifting based on the changes in samplerate/REF_CTRL and GAIN. So the changes in the average noise we saw thusfar are partially due to the fact that one or more of these bands suddenly appeared/disappeared in the spectrum.
So ... the results look inconclusive and show that one can be easily tricked into seeing "hopeful" results when not all settings are tested in a standardized way. In the next part of this story I will try to show another way of looking at the noise. For that I will not be using the silence but only the recorded signal and testing for harmonics.
Last edited:


